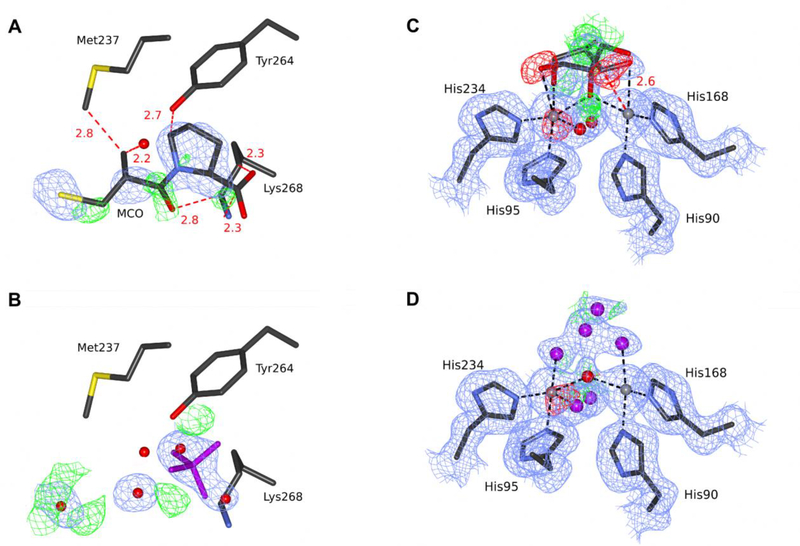
Figure 4.
The substrate-binding site in two structures of FEZ-1 from Legionella gormanii. (A) The original 1jt1 deposit is modeled with D-captopril, and (B) the re-refined deposit 5w90 is modeled with an unknown ligand. (C) The original 1k07 deposit is modeled with a glycerol molecule in two conformations, and (D) the re-refined deposit 5wck is modeled with a set of unknown atoms. C atoms are shown in dark gray, N in blue, O in red (water as a sphere), S in yellow, Zn ions as gray spheres, UNX in magenta. The electron density maps are contoured at 1.0σ for 2mFo-DFc (blue) and +/−3.0σ for mFo-DFc (green/red). Black dash lines represent coordination bonds, red dash lines with distance labeled in Å represent steric clashes between the D-captopril molecule and surrounding residues. The ligands and the electron density maps, including omit maps, can be inspected using interactive figures created with Molstack (http://molstack.bioreproducibility.org/project/view/xpzboZ6XwokZ2DvYO9sH/http://molstack.bioreproducibility.org/project/view/xpzboZ6XwokZ2DvYO9sH/for 1jt1/5w90 and http://molstack.bioreproducibility.org/project/view/lSoPdEAwzOw4y8jthr2Z/for1k07/5wck).

