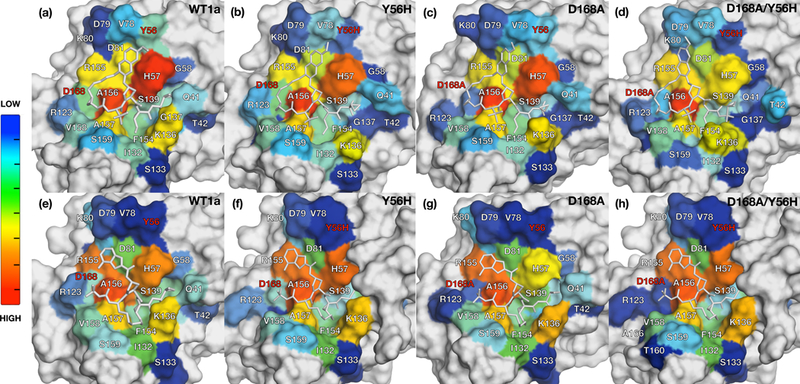
Figure 5: Packing of inhibitors in the NS3/4A protease active site during MD trajectories.

The van der Waals (vdW) contact potentials averaged from MD simulations of protease active site residues for grazoprevir bound to (a) WT1a, (b) Y56H, (c) D168A, (d) Y56H/D168A and danoprevir bound to (e) WT1a, (f) Y56H, (g) D168A, (h) and Y56H/D168A proteases, respectively. The warmer (red) and cooler (blue) colors indicate more and less contacts with the inhibitor, respectively. Drug resistance residues are highlighted in red. See also Figures S2 and S3.
