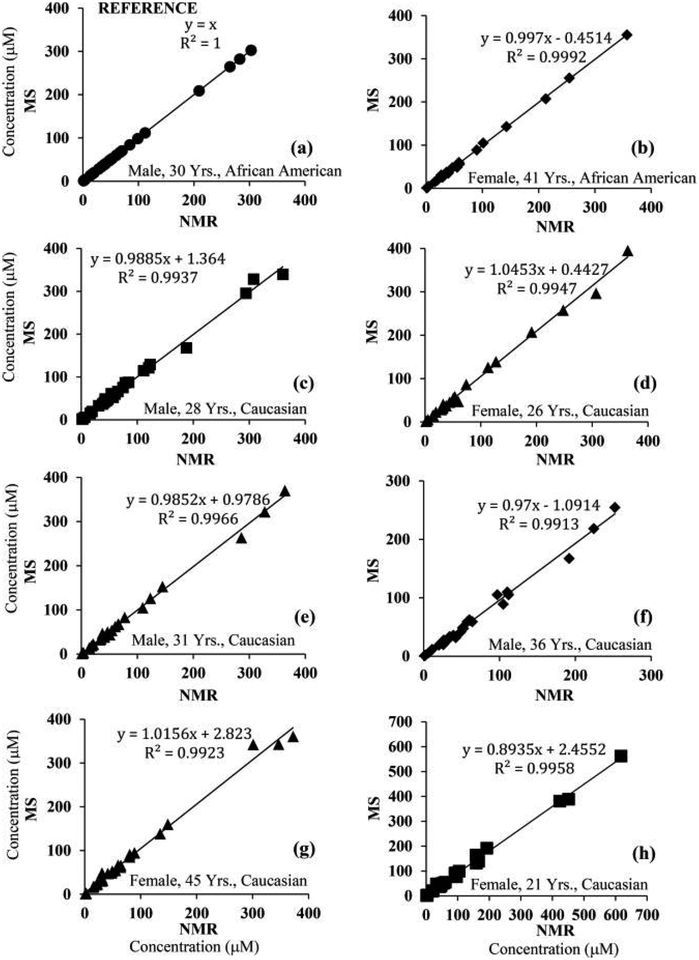
Figure 3.
Correlations of concentrations for metabolites derived from NMR and NMR-guided MS for eight healthy-human-serum samples. Here, MS concentrations for one serum sample were set equal to those derived from NMR for the same serum sample (serum 5, Table S3, R2 = 1; a); these concentrations, along with their MRM peak areas were used as references for the quantitation of the same metabolites in the remaining serum samples (b–h). Virtually identical results were obtained irrespective of the serum sample that was used as the reference. Glutamine and pyroglutamic acid were omitted because of errors arising from glutamine cyclization;15,25,26 lactate and glucose were also omitted for clarity (see Figure S3 for data for all 30 metabolites).

