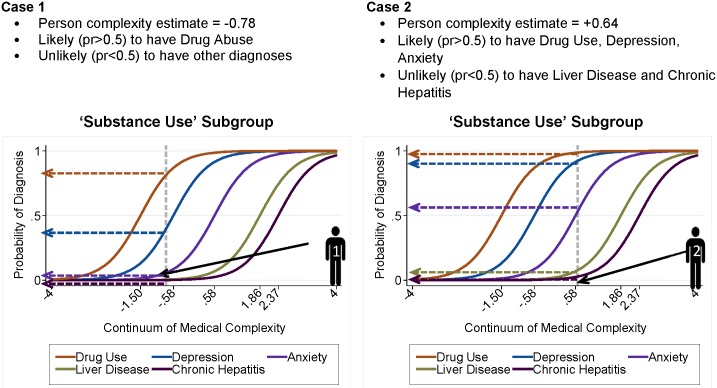
Fig 1. Interpreting IRT item characteristic curves (ICC) as defined by medical diagnoses for two example patients from the same subgroup.
This figure illustrates fundamental aspects of IRT models using two hypothetical patients from the same subgroup. Medical conditions and persons are each given estimates which place them on the construct, medical complexity; estimates represent amount of complexity captured by the medical condition or person. Here, the two patients represent low and high amounts of complexity and consequently, which medical conditions they were likely to have given their levels of complexity.

