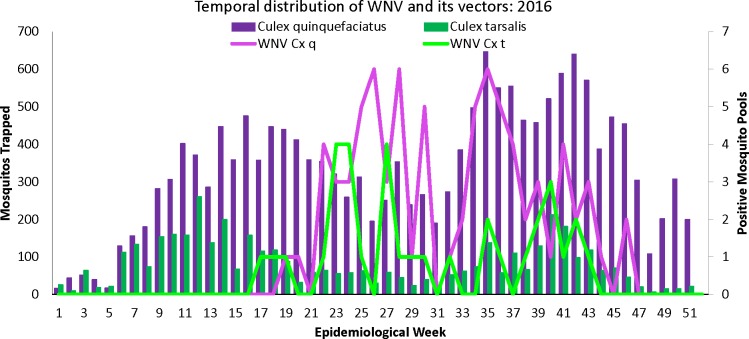
Fig 4. Distribution of Culex mosquitoes and WNV positive pools in Maricopa County by epidemiological week in 2016.
The first y-axis represents the number of Culex quinquefasciatus (purple bars) and Culex tarsalis (green bars) individuals trapped each epidemiological week. The second y-axis represents the number of WNV positive Culex quinquefasciatus (purple line) and WNV positive Culex tarsalis (green line) mosquito pools trapped each epidemiological week.

