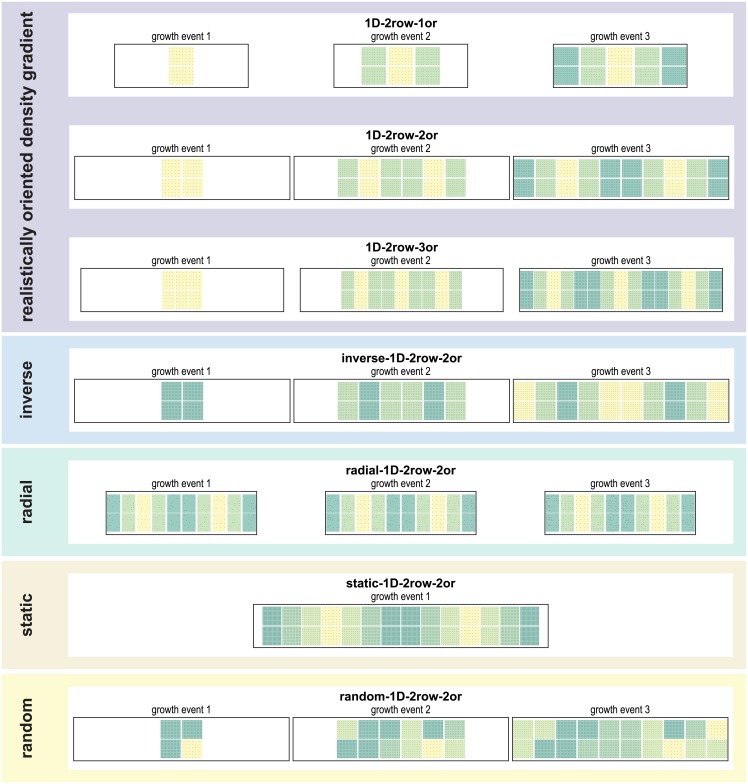
Fig 2. Developmental trajectories of growth layouts.
The figure illustrates the spatiotemporal growth trajectory for different growth layouts. The successive population of the cortical sheet with neurons is shown for the first three growth events. For static growth, all neurons grow simultaneously, hence only one growth event is shown. Here, all growth layouts of growth mode 1D 2 rows are shown. See S1 Fig for an illustration of the developmental trajectories of all 21 growth layouts.

