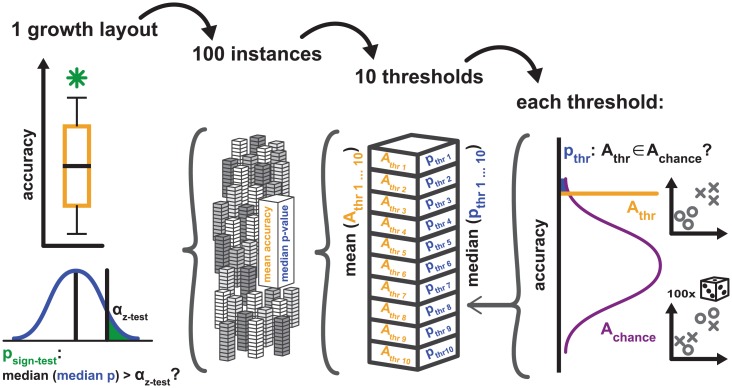
Fig 3. Validation procedure for measures of simulation-to-empirical classification performance.
The figure illustrates the general procedure for assessing the performance of the classification of empirical data from the cat and macaque cortex by classifiers that were trained on simulated data; see main text for details. We computed median measures of classification performance for each growth layout and compared these measures against chance performance, as assessed by a permutation analysis. Specifically, for each of the 21 growth layouts shown in Fig 8 and Table 4, 100 instances were simulated. For each instance, classification was performed using 10 different classification threshold probabilities. For each threshold probability, a simulation-trained classifier assigned labels to the empirical data, resulting in an accuracy value Athr. Additionally, a distribution of chance performance accuracies, Achance, was generated by classifying 100 times from randomly permuted non-sensical labels. A z-test quantified the probability that Athr was an element of the distribution of Achance. The corresponding p-value pthr was used for further calculations. For each simulation instance, classification performance from all 10 threshold probabilities was averaged, resulting in one mean accuracy value and one median value of pthr per instance, thus amounting to a total of 100 values each per growth layout. Fig 8 shows the distribution of mean accuracy values from these 100 instances, and indicates the median accuracy. The indication of significance in Fig 8 refers to the p-value obtained from a sign-test which assessed whether the median of the distribution of median values of pthr was larger than the chosen significance threshold αz-test of 0.05 (with a small value of psign-test indicating that pthr was very unlikely to be larger than αz-test). Table 4 includes the median accuracy, median z-test p-value and the result of the sign-test. Shown here for accuracy, the procedure was analogous for the Youden index J, which is shown in Fig 9 and Table 4.

