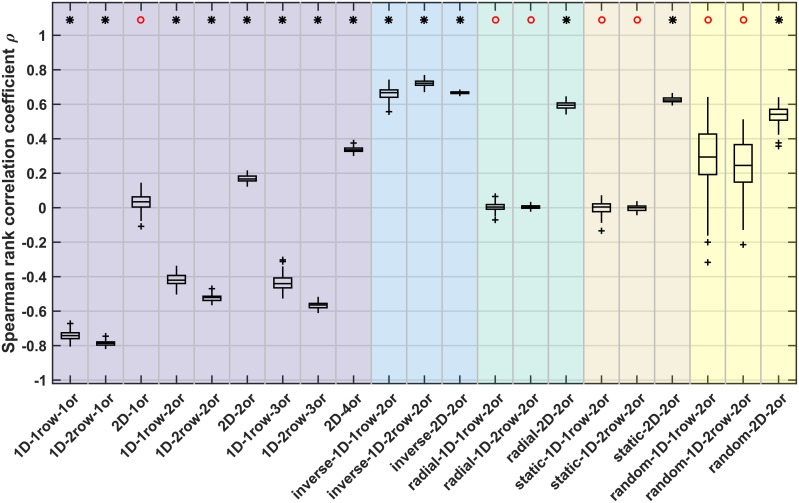
Fig 7. Correlation of area degree with neuron density.
Spearman rank correlation coefficients for the correlation between area degree (number of connections) and area neuron density. A sign test was used to test whether the distribution of associated Spearman rank correlation p-values had a median value smaller than α = 0.05. The result of the sign test is indicated on top; black star: median p < 0.05, red circle: median p > = 0.05. See S3 Fig for representative plots of the correlation for individual simulation instances. Box plots show distribution across 100 simulation instances per growth layout, indicating median (line), interquartile range (box), data range (whiskers) and outliers (crosses, outside of 2.7 standard deviations). See Table 3 for a summary. Abbreviations and background colours as in Table 1.

