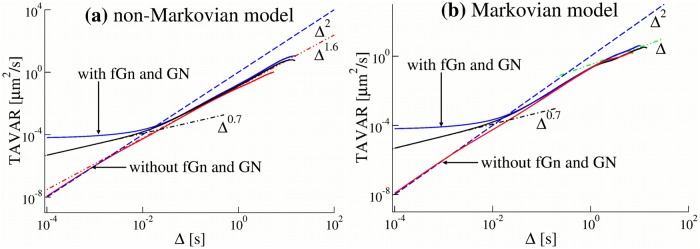
Fig 5.
(a) TAVAR for trajectories generated by the non-Markovian rate model and (b) by the Markovian rate model. Parameters of the models were the same as in Fig 4. Power-law scaling trends are shown with ∼ Δ0.7 for sub-diffusion (black dashed-dotted line), Δ1.6 for super-diffusion (red dashed-double dotted lines), Δ for normal diffusion (green dashed-double dotted lines) and Δ2 for ballistic motion (blue dashed line).

