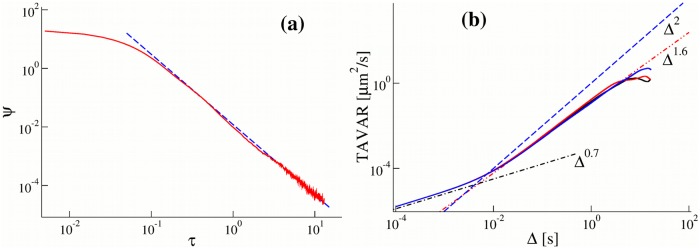
Fig 7.
(a) The probability density function (pdf) of residence times of a cargo on a microtubule, ψ(τ), for an ensemble of N = 6 motors (solid curve) calculated using Eq (4) with a particular set of pi and λi. We chose pi such that ∑i pi = 1. The dashed curve is the power-law fit ψ(τ) ∼ Aτ−μ−1 with μ = 1.4 and A = 0.012. This power-law pdf corresponds to the rate , which is consistent with the long time behaviour of Eq (6). Notice that 12 parameters (pi and λi) are parametrized by only two parameters A and α. (b) The time averaged variances TAVARs (the time averaged mean squared displacements corrected for the drift) calculated along single trajectories generated with the residence times of the cargo on the microtubule shown in (a) grow as Δ3−μ = Δ1.6 (red dashed-double-dotted curve).

