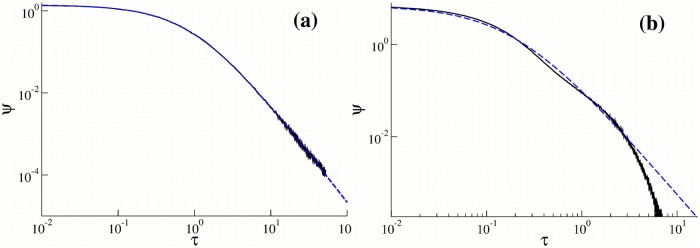
Fig 8.
(a) The probability density function ψ(τ) (black solid curve) of resident times of cargo on a microtubule for a heterogeneous ensemble of motors with λ distributed with the gamma density Eq (7) with μ = 1.4 and τd = 1 s (Case 2). The blue dashed curve is given by Eq (8). (b) The probability density function ψ(τ) of resident times of cargo on a microtubule (black solid curve) for N = 3 cooperative motors (Case 3). Other parameters are given in Ref. [26]. The blue dashed curve is given by Eq (8) with μ = 1.4 and τd = 0.18 s.

