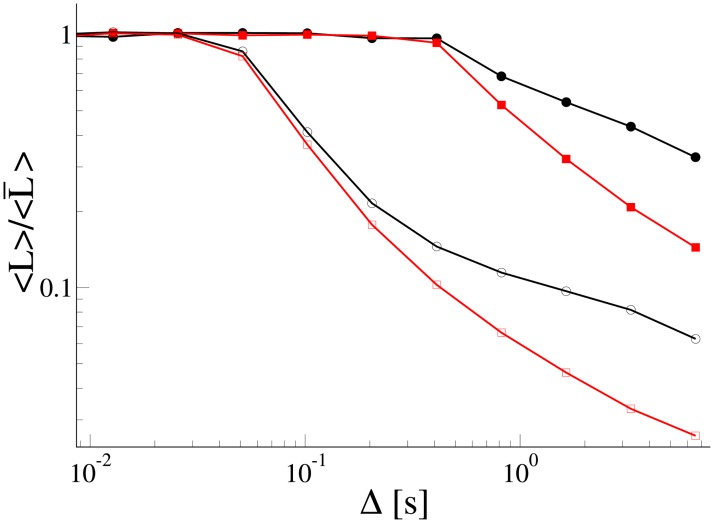
Fig 9. Average distance 〈L〉 the cargo travelled over a time interval Δ on the microtubule with a blocking filament located at distance l1 = 0.1 μm (curves with open symbols) and l1 = 0.5 μm (curves with filled symbols) from x = 0, Fig 3(b).
The distance 〈L〉 was normalized by the average distance the cargo travelled without the blocking filament. We used 3000 trajectories generated by the Markovian rate model (red squares) and the non-Markovian rate model (black circles) to calculate the average distances. Parameters of the models are the same as in Fig 4.

