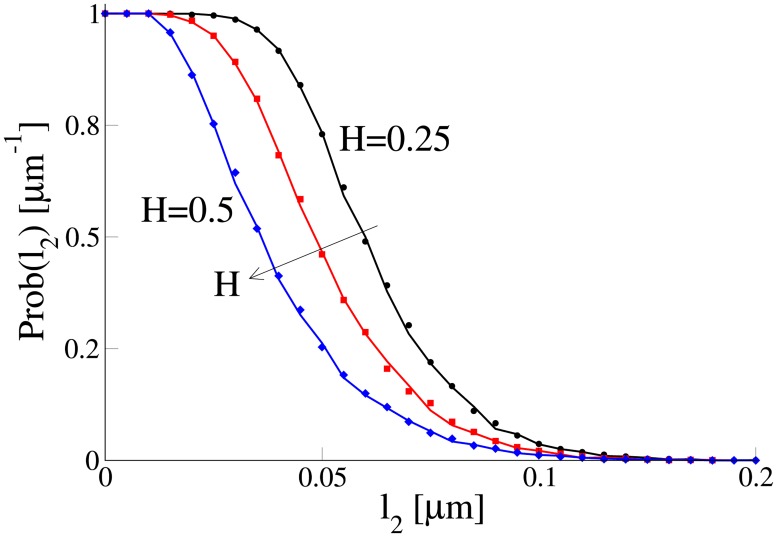
Fig 10. Probability Prob(l2) for a cargo to reach a neighbouring filament located at distance l2 μm (see Fig 3(c)) in the time interval ΔT = 16.4 s.
The probability is calculated for Hurst exponents of H = 0.25 (black), H = 0.35 (red) and H = 0.5 (blue) (see the arrows for the trend) using 3000 trajectories generated by the Markovian rate model (symbols) and non-Markovian rate model (curves). Parameters of the models were the same as in Fig 4.

