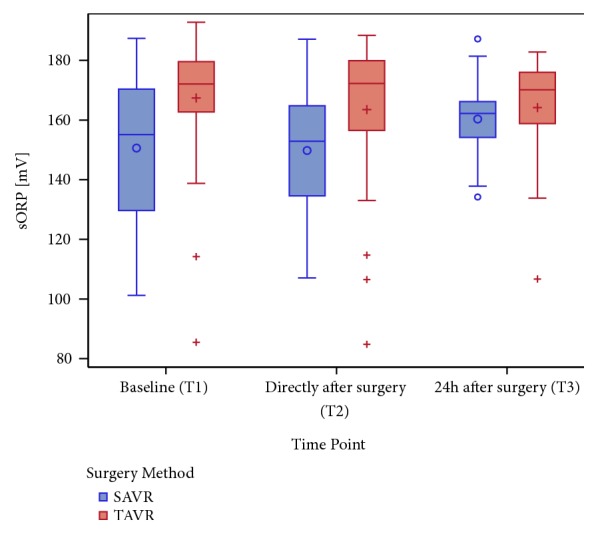
Figure 2.

Boxplot of sORP in mV at all time points (categorical presentation is on the x-axis: T1, T2, and T3), categorized by surgery methods (SAVR versus TAVR). Note that the baseline sORP in the TAVR cohort is significantly higher compared to that of the SAVR group.
