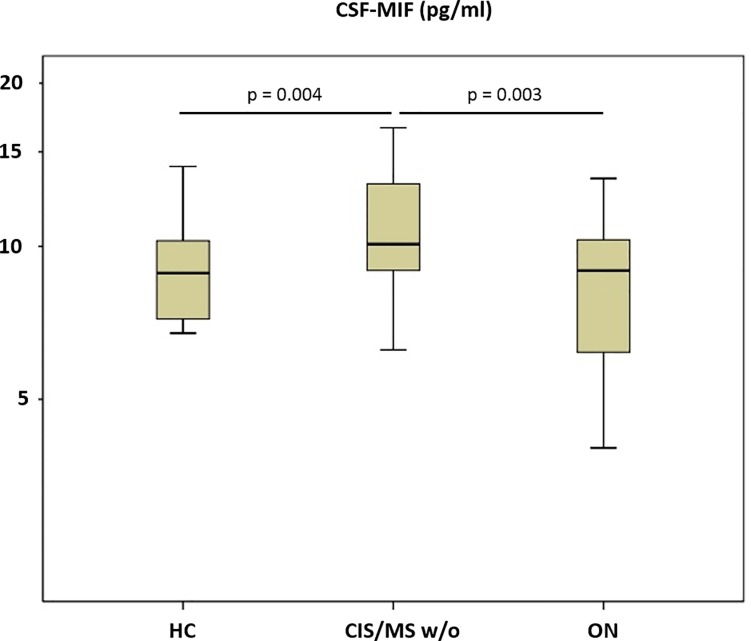
Fig 1. Macrophage migration inhibitory factor (MIF) in cerebrospinal fluid (CSF).
HC = healthy controls. CIS/MS w/o = Clinically isolated syndrome or multiple sclerosis without an acute relapse, ON = optic neuritis. Boxes indicates the interquartile range, bars indicates median CSF-MIF values, and whiskers present the 95% CI. Group comparisons were conducted using an ANOVA with post-hoc Bonferroni-testing. P-values ≤ 0.05 were deemed to be statistically significant. MS w/o patients showed higher CSF-MIF levels than HC and ON patients, while the latter did not differ.

