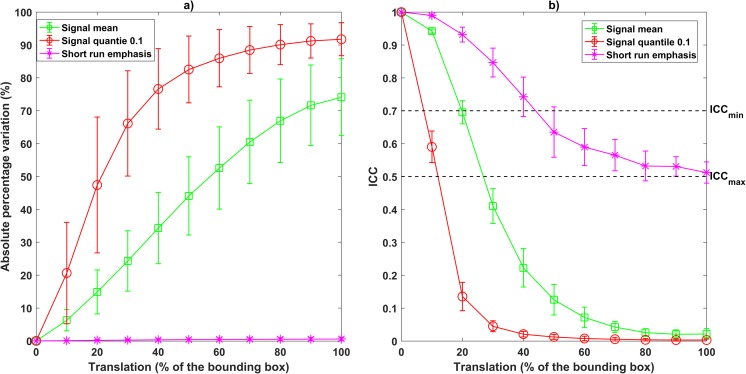
Fig. 9.
Plot representing the variation with respect to entity of translation for 3 different radiomic features measured on the soft tissue sarcoma (STS) dataset, with 16-bin discretization. a Absolute percentage variation plot. b ICC variation. One representative of each group of feature is represented: signal mean (squared markers) is both stable and discriminative; signal quantile 0.1 (circular markers) is unstable; short run emphasis (asterisks) is non-discriminative. Both mean values and 95% confidence interval are shown

