
Figure 1.
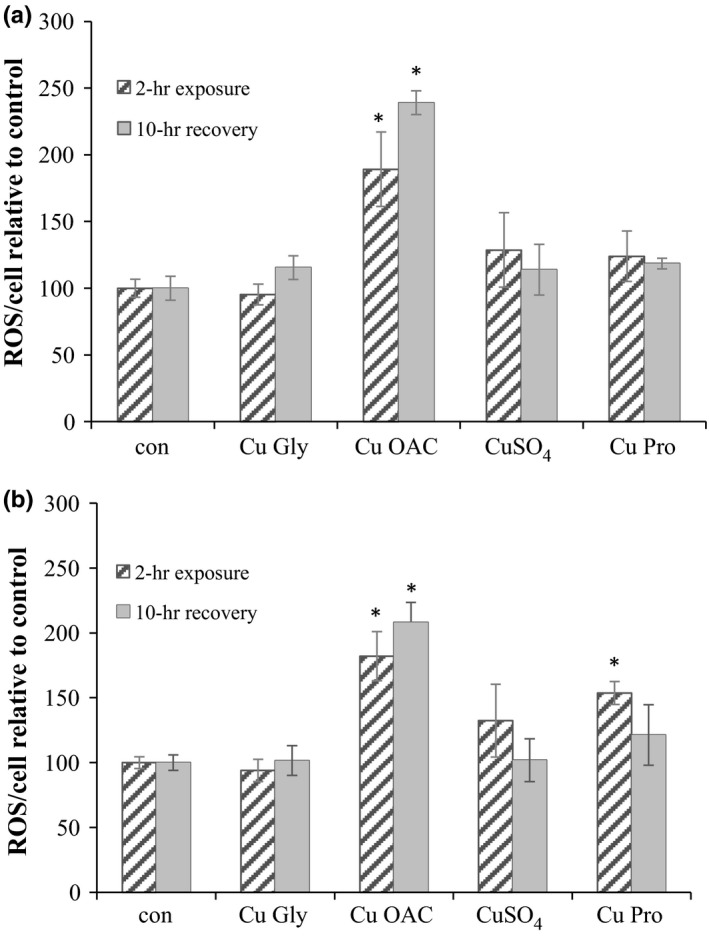
ROS production in HT29 (a) and Caco‐2 (b) after 2‐hr exposure and 10‐hr recovery. Results are the average of at least three separate repeats. * denotes statistical significance of p < 0.05 compared to the control for either 2‐hr exposure or 10‐hr recovery. ROS, reactive oxygen species