
Figure 2.
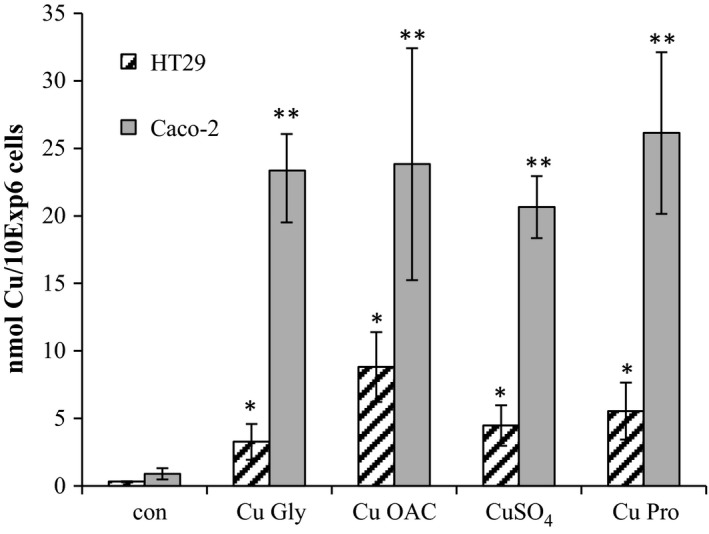
Copper uptake after 2‐hr exposure to copper compounds as measured by LC‐ICP‐MS. Results are the average of three separate repeats. * and **denotes significant differences for HT29 and Caco‐2 cells, respectively, exposed to coppers relative to control (p < 0.05)