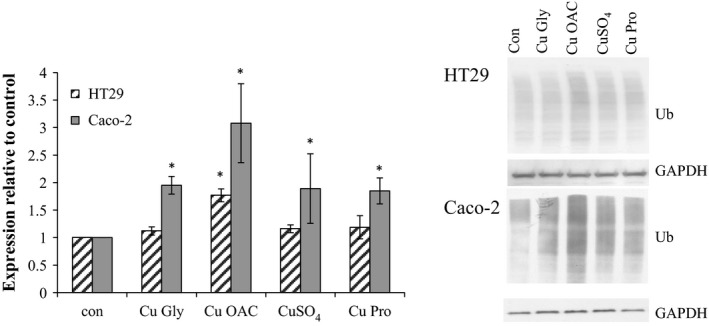
Figure 8.

Expression of high molecular weight ubiquitinated proteins in HT29 and Caco‐2 cells with GAPDH as the loading control. Results are the average of at least three separate repeats. Representative blots are shown. Asterisks indicate p < 0.05 when compared to the control
