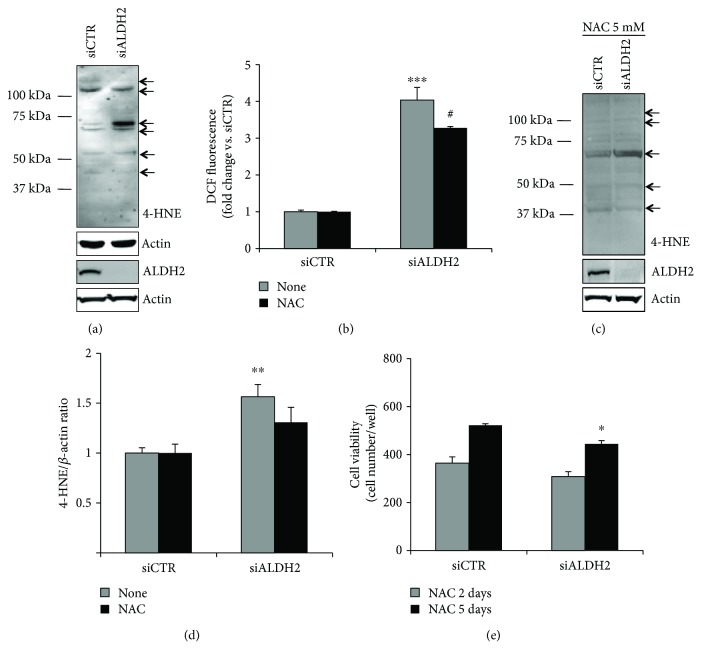
Figure 3.
ALDH2 silencing increases 4-HNE protein adducts and ROS levels. (a) Western blot analysis of 4-HNE protein adducts in siCTR and siALDH2 ECs cultured in 2% FBS for 24 h. Knockdown efficiency was checked using immunoblotting with an ALDH2 antibody. The arrows indicate bands quantified in (d). Representative blots of at least 3 with similar results are shown. (b) ROS production in siCTR and siALDH2 ECs cultured in 0.1% FBS for 24 h in the presence/absence of NAC (5 mM). Cells were pretreated for 30 min with NAC before FBS treatment. Data, normalized for the cell number, are expressed as the mean of fold change ± SD vs. siCTR of DCF fluorescence. ∗∗∗p < 0.01 vs. siCTR; #p < 0.05 vs. untreated siALDH2 ECs. (c) Western blot analysis of 4-HNE protein adducts in siCTR and siALDH2 ECs cultured in 2% FBS for 24 h with or without pretreatment (30 min) with NAC (5 mM). Knockdown efficiency was checked using immunoblotting with an ALDH2 antibody. The arrows indicate bands quantified in (d). Representative blots of 3 with similar results are shown. (d) Quantification of major bands (indicated with arrows), normalized to actin, is reported as a fold increase ± SD of ADU vs. siCTR. ∗∗p < 0.01 vs. siCTR. (e) Cell survival in siCTR and siALDH2 ECs exposed to 2% FBS in the presence/absence of NAC (5 mM) for 2 (grey bars) or 5 (black bars) days. Data are expressed as means ± SD of the cell number counted/well. ∗p < 0.05 vs. siCTR. Images are representative of results obtained with siALDH2 B.

