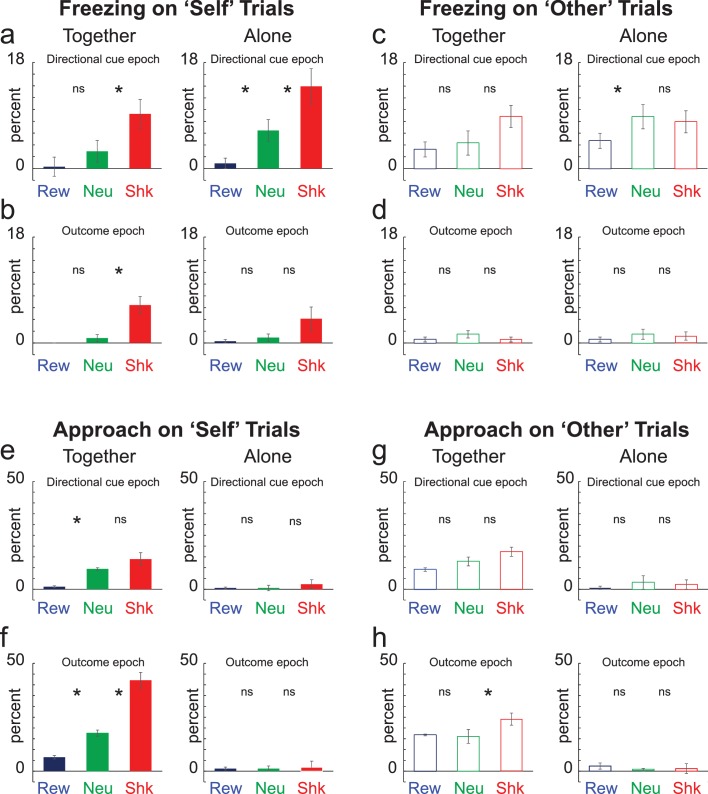
Figure 3. Freezing and Approach.
(A–D) Percent freezing over 12 trial types for ‘self’ (A,B; solid) and ‘other’ (C,D; open) trials during the 5 s directional cue epoch (A,C) and the 5 s outcome epoch (B,D) when rats were ‘alone’ (left) and ‘together’ (right). Blue = Reward; Green = Neutral; Red = Shock. (E–G) Contingencies same as A-D except for percent approach. Note that n = 34 instead to 40 due to technical issues during video recording. *Wilcoxon; p < 0.05.

