. 2018 Oct 19;7:e39911. doi: 10.7554/eLife.39911

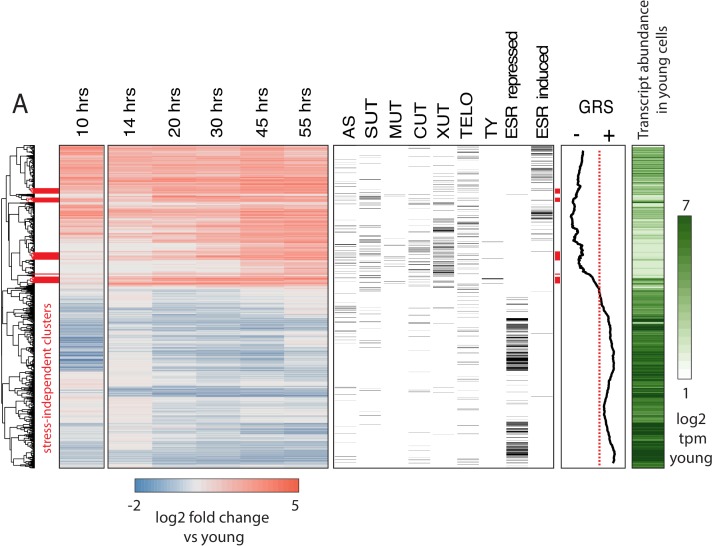
Figure 2. Age-dependent gene expression dynamics.

(left) Hierarchically clustered heatmap of transcriptome at increasing replicative ages of ~ 2900 genes (the transcriptome at 10 hr is conflated with cell beading). Different transcript types are labeled in black directly to the right of the transcriptional data. (AS = antisense, SUT = stable unannotated transcript, MUT = meiotic unannotated transcript, CUT = cryptic unstable transcript, XUT = Xrn1 sensitive unstable transcript, TELO = subtelomeric, TY = TY repeat element, ESR = environmental stress response). (right) Moving window average (of 100 gene bins) of Growth Rate Slopes from Brauer et al. and log2 transcript abundances in transcripts per million during initial log-phase growth (green). Red bars indicate clusters displaying early-age induction independent of the ESR.

Figure 2—source data 1. Physiological parameters collected from aging time courses.
DOI: 10.7554/eLife.39911.016
Figure 2—source data 2. Strains.
DOI: 10.7554/eLife.39911.017

Figure 2.

Figure 2—figure supplement 1. Enriched GO terms in the aging transcriptome.
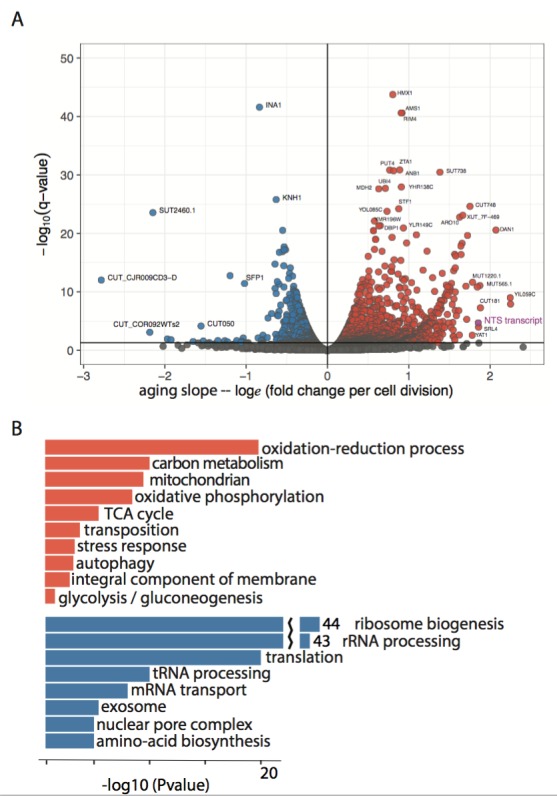
Figure 2—figure supplement 1.

(A) Volcano plot of ~2900 significantly changing transcripts (ORF +non canonical transcripts) with age as modeled using Sleuth. The non-transcribed sequence (NTS) of the rDNA locus is one of the largest measured increases (purple). (B) Subset of GO terms enriched in upregulated and downregulated genes from (A).
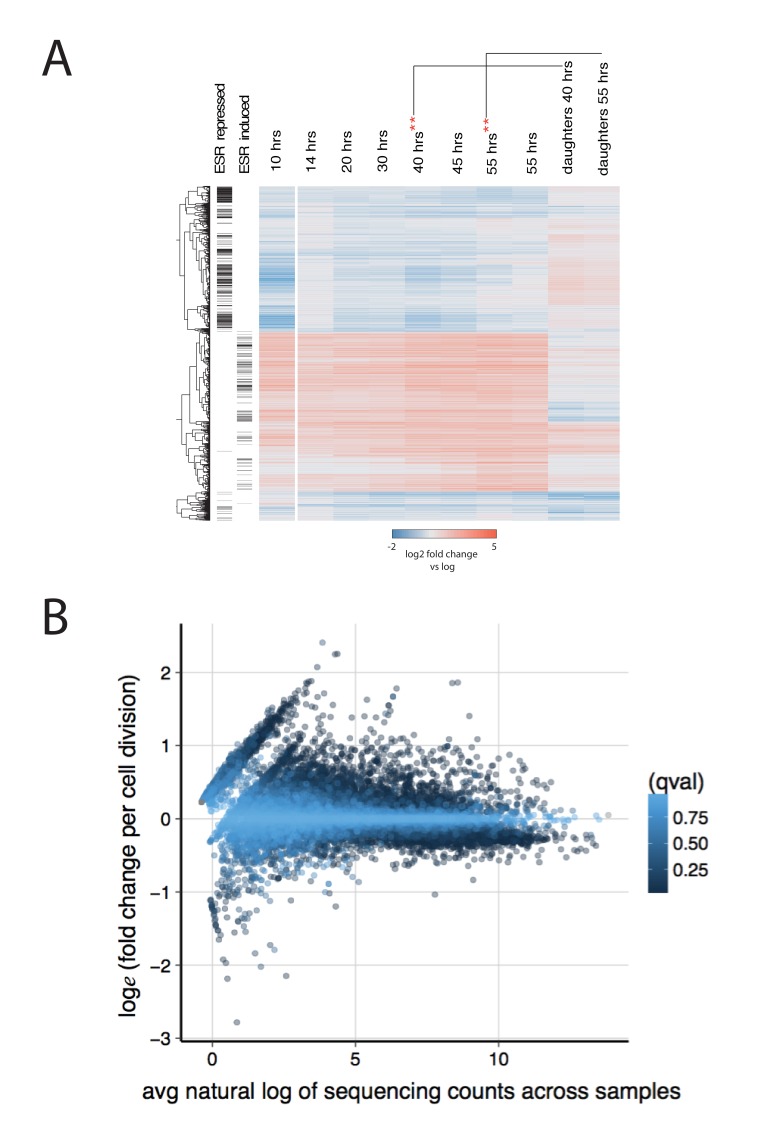
Figure 2—figure supplement 2. Further characterization of the aging transcriptome.

Figure 2—figure supplement 2.

(A) Transcriptome from Figure 2, along with an additional 40 hr and 55 hr time point from a separate MAD (**) and a pure population of daughters from those time points. (B) The effect of transcript abundance on gene expression with age. The aging slope for all transcripts was plotted against the mean natural log of sequence read counts across all samples. Each transcript (dot) is colored by its q-value. In general, low abundance transcripts are more likely to increase expression than decrease expression with age.
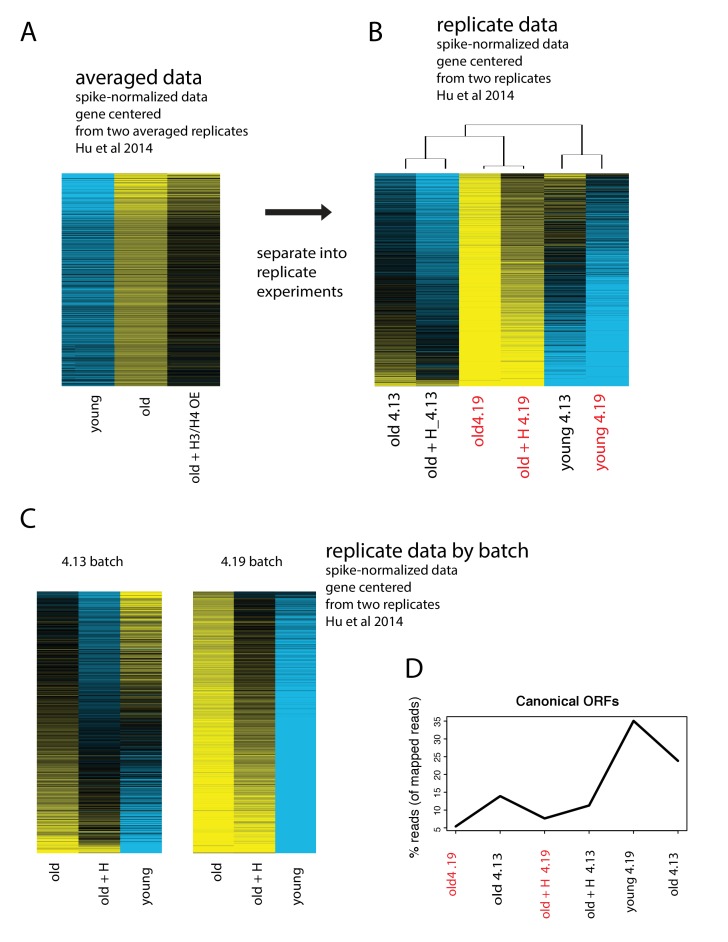
Figure 2—figure supplement 3. Batch effects drive the age-dependent global expression increase observed in Hu et al., 2014.

Figure 2—figure supplement 3.

(A) Data from Hu et al. of spike-normalized RNA-seq data showing that in absolute terms, transcripts increase with age. Replicate experiments were averaged. (B) Spike-normalized data split into replicate experiments, ‘4.13’ and ‘4.19’, and row-normalized. Data from old cells from batch ‘4.19’ are highlighted in red to point out that the majority of the global upregulation arises from this batch. (C) Re-analysis of the exact same spike-normalized data separated by batch reveals that universal upregulation of genes is only present in batch 4.19. (D) Re-analysis and realignment of raw data reveals extremely low mapping rates for batch 4.19.