
Figure 4:
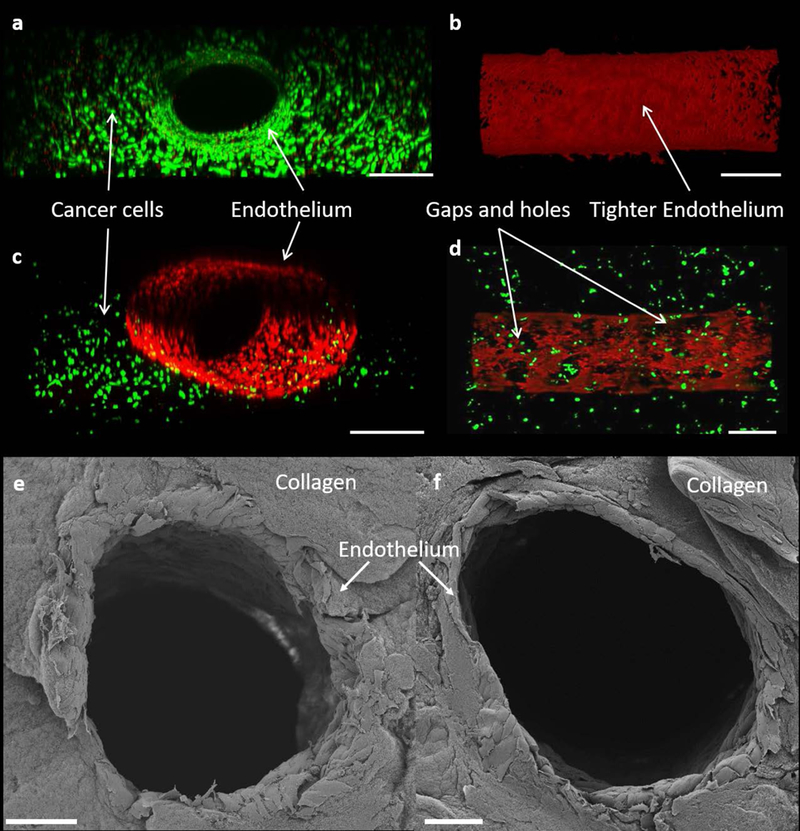
Imaging of cell viability and confluence within the single vessel platform obtained upon immediate completion of preconditioning protocol and staining. (a) Front view of co-culture viability test, scale bar is 500 μm (b) Top view of f-actin stained mono-culture endothelium, scale bar is 500 μm. (c) Isometric 3D view of endothelium surrounded by cancer cells, scale bar is 500 μm. (d) Top view of f-actin stained endothelium in a co-culture environment, scale bar is 500 μm. (e,f) Cross sectional view of SEM images of the endothelium showing a cylindrical endothelium in the TIME monoculture (e) and MDA-MB-231 and TIME cell co-culture (f), scale bars are 100 μm.