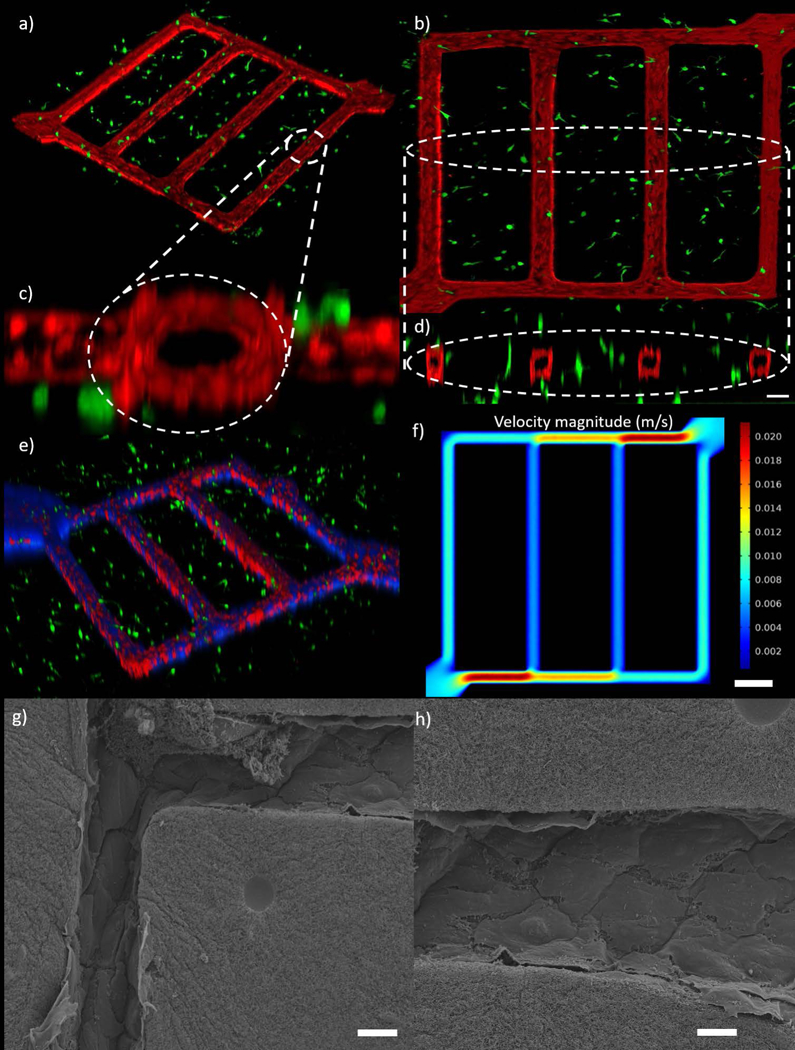
Figure 6:

In vitro tumor microenvironment microvascular network. (a) Isometric view of network co-culture of TIME cells and MDA-MB-231 cells. (b) Top view of the co-culture network (c) Cross section view of channel near inlet. (d) Cross section view of 4 channels, scale bar is 100 μm. (e) Transport of blue particles through the network. (f) Model predicted velocity magnitude inside tumor microenvironment microvascular network using finite element method, scale bar is 400 μm (g, h) SEM images the microchannels in the network platform showing a patent and continuous endothelium at the corners (g) and in one of the channels (h), scale bars are 20 μm.
