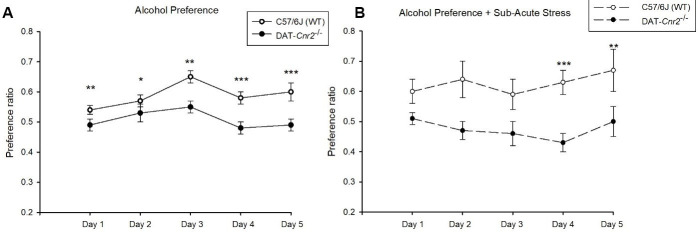
Figure 4. Preference ratio for alcohol over water in normal conditions (A) and in response to an acute stress protocol (B) exhibited by wild-type mice (white circles) and DAT-Cnr2 cKO mice (black circles) during 5 consecutive days.
Data presented as the Mean ± standard error of the mean (SEM) daily consumption ratio over 5 days. Significant difference between genotypes paired t-test (*P < 0.05, **P < 0.01, ***P < 0.001).

