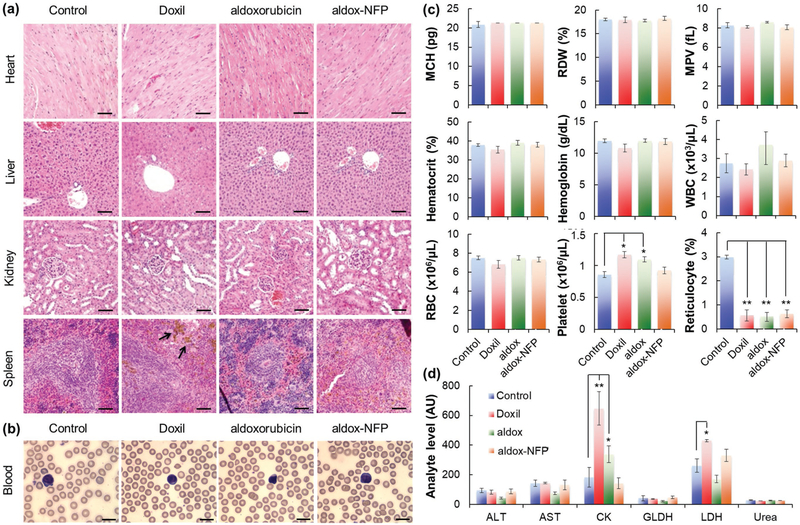
Figure 8.
Aldox-NFP displays a low in vivo toxicity profile. a) Histopathologic evaluation of the major organs after any treatment. Black arrows indicate brown hemosiderin granules in the spleen. The scale bar represents 50 μm. b–d) Blood was withdrawn from the animals at the conclusion of each treatment for analysis. b) Blood smear test used to evaluate the number and shape of the blood cells. The scale bar represents 10 μm. c) Whole blood biochemistry indexes. Data were presented as mean ± standard deviation (SD). (MCV = mean corpuscular volume, MCH = mean corpuscular hemoglobin, RDW = red cell distribution width, MPV = mean platelet volume, WBC = white blood cell, RBC = red blood cell). d) Serum analyte activity for liver (ALT, AST, GLDH, LDH) or muscle injury (CK, AST, LDH). Data were presented as mean ± standard deviation (SD) (*P < 0.05, **P < 0.01). (ALT = alanine aminotransferase, AST = aspartate aminotransferase, CK = creatine kinase, GLDH = glutamate dehydrogenase, LDH = lactate dehydrogenase).

