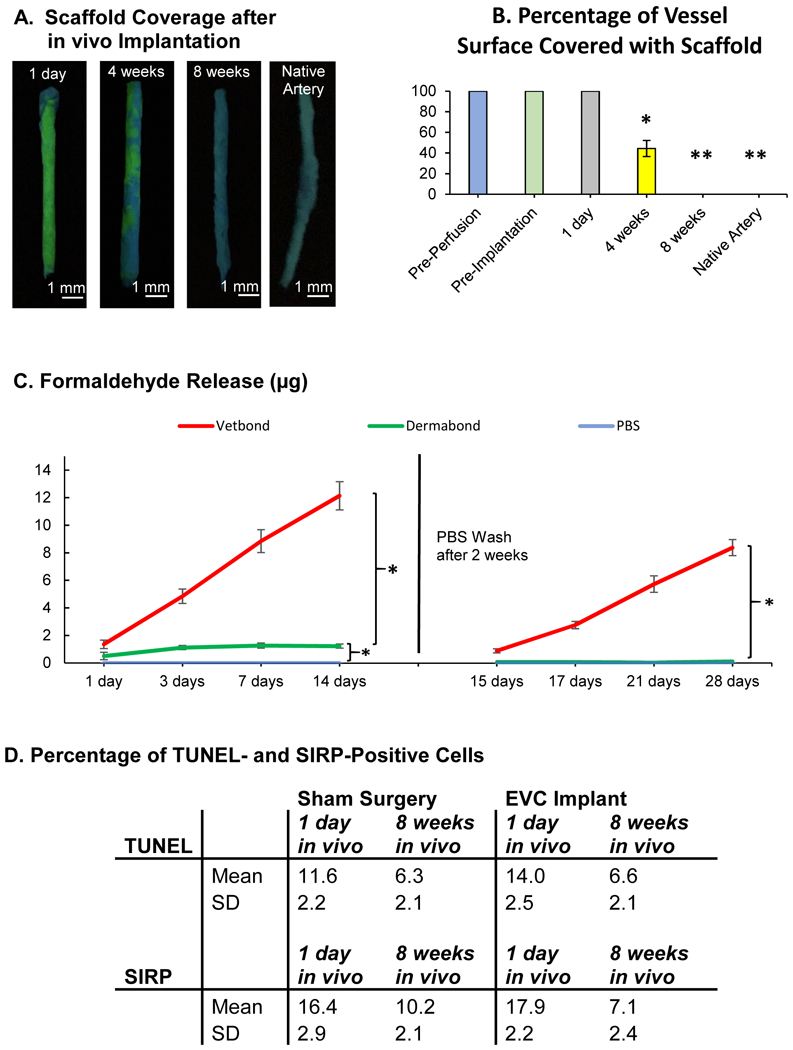
Figure 8.

(A) Engineered vascular conduits (EVCs) and native arteries were stained with a fluorescent dye (Basic Yellow 40) to label the cyanoacrylate scaffold at 1 day, 4 weeks, and 8 weeks after implantation in vivo. UV light, Basic Yellow 40: yellow-green fluorescent. (B) Percentage of the EVC surface covered with scaffold immediately before in vitro perfusion, immediately before implantation, and at 1 day, 4 weeks, and 8 weeks after implantation in vivo. p<0.05 for 4 weeks in vivo vs. all other groups, and p<0.01 for Pre-Perfusion, Pre-Implantation, and 1 day in vivo vs. 8 weeks in vivo and Native Artery, n=5 for all samples (one-way ANOVA followed by Tukey’s Test). (C) Fluorometric measurements of cumulative formaldehyde release after polymerization of N-butyl cyanoacrylate (Vetbond) and N-octyl cyanoacrylate (Dermabond, EVC scaffold), compared to phosphate buffered saline (PBS), n=5 for all samples (two-way ANOVA for repeated measures). (D) Percentage of cells staining positive for terminal deoxynucleotidyl transferase dUTP nick end labeling (TUNEL, cell death) and signal regulatory protein α (SIRP, granulocytes, macrophages) in standardized tissue sections (1 cm2 × 10 μm) at 1 day and 8 weeks after EVC implantation in vivo or after sham surgery, n=4 for all samples p= not statistically significant (Student’s t-test). * indicates p<0.05. ** indicates p<0.01. SD = standard deviation.
