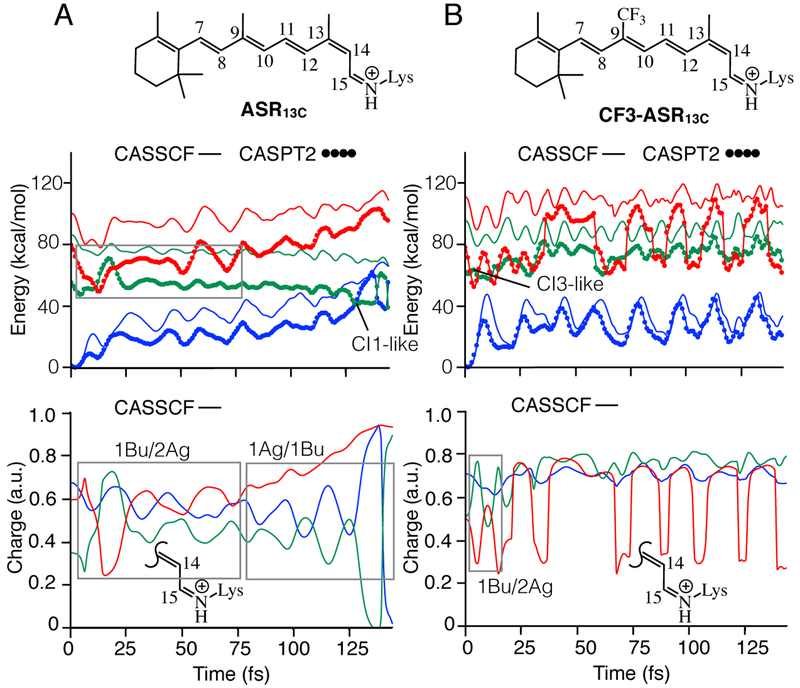
Figure 2.
Effect of CF3 substitution on the relaxation of ASR13C. A. CASSCF and CASPT2 energy profiles (top panel) and evolution of charge on the Schiff base side (bottom panel) of ASR13C. B. Same data for CF3-ASR13C. S0, S1 and S2 PESs are shown in blue, green and red colors. The profiles shown in bottom panels are the positive charge on the displayed molecular fragment.

