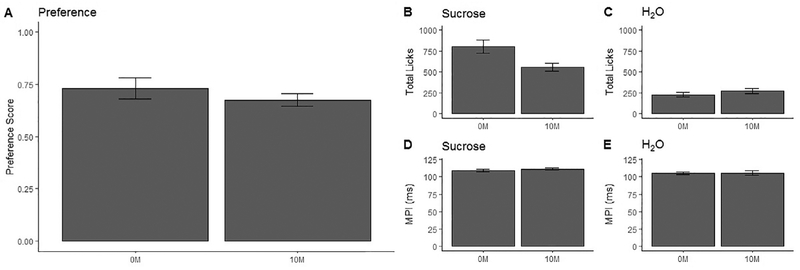
Fig. 6.
Comparisons of lick data between recording conditions of 10 M and 0 M of added resistance. A: Preference score (calculated as licks to sucrose/licks to sucrose + licks to H2O) (± S.E.M.), B: Average total licks to sucrose counted (± S.E.M.), C: Average total licks to tap water counted (± S.E.M.), D: Mean primary interlick interval (MPI) of sucrose licks calculated (± S.E.M.), E: MPI of tap water licks calculated (± S.E.M.).

