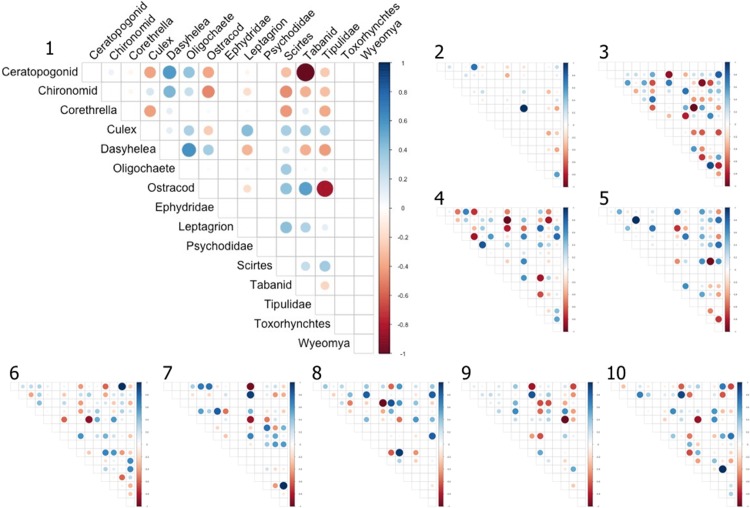
Fig 3. Relative strength of species interactions in every site.
Species interactions are scaled to 1. Where rows or columns are empty, that particular species is not in that site. Blue indicates positive interactions and red indicate negative interactions. Positive interactions represent species than tend to co-occur, negative interactions represent species that do not tend to co-occur.

