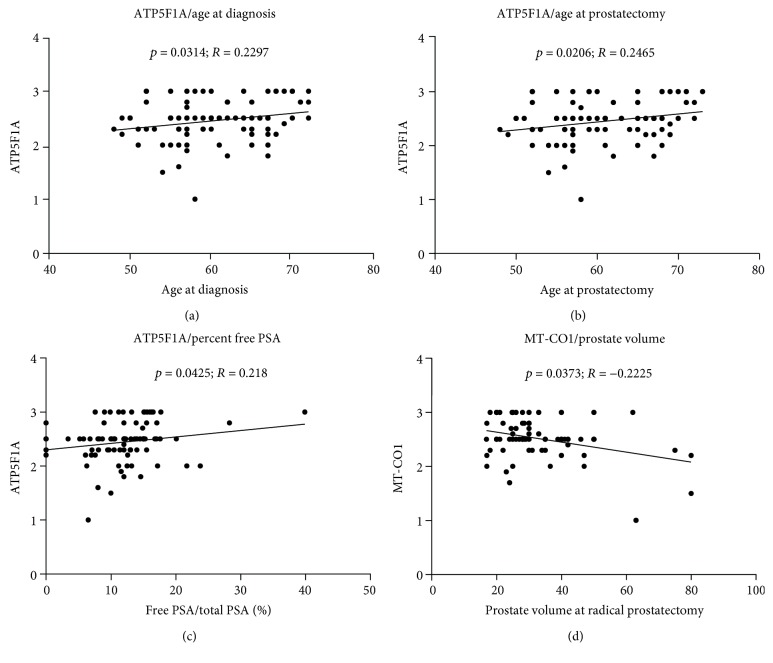
Figure 5.
Correlation between clinical parameters and the levels of OXPHOS complexes. Correlation between ATP5F1A level and age at diagnosis (a), age at prostatectomy (b), and percent free PSA in relationship to total PSA (c). (d) Correlation between MT-CO1 levels and prostate volume at prostatectomy.

