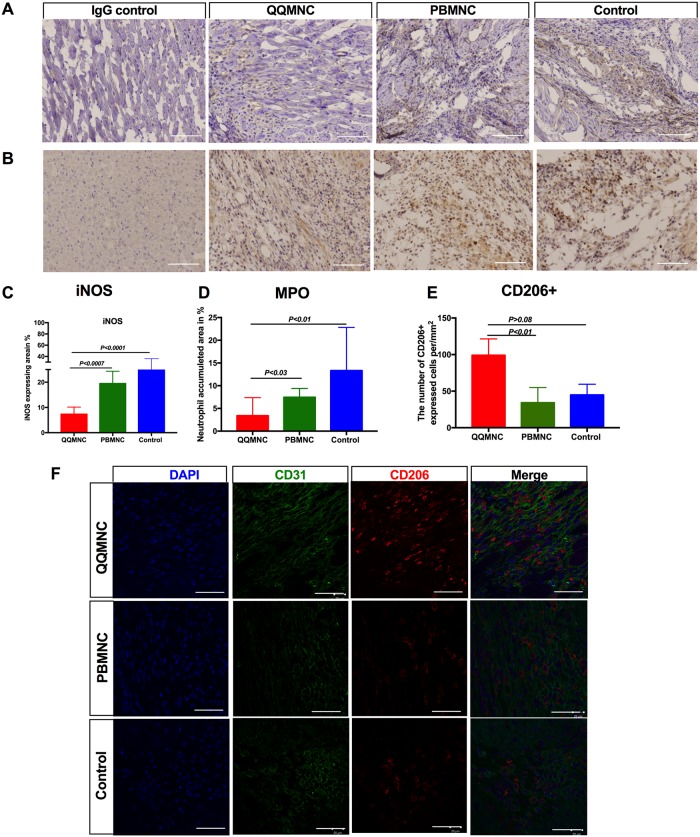
Fig 7. Anti-inflammatory effect of RACs.
(A and C) Immunohistochemical analysis showed that the iNOS expressing infarct area was more extended in PB-Tx and Control groups than in QQ-Tx. (B and D) Neutrophil rich area was significantly lower in QQ-Tx. (E) The number of infiltrated CD206+ cells after MI were significantly increased in QQ-Tx compared with PB-Tx and Control groups. (F) Images are showing CD206+ cell recruitment into the infarcted tissue in the acute MI phase. IHC staining was done 6 days after onset of MI. Scale bar: 50 μm for iNOS and MPO, and 20 μm for CD206+. iNOS-inducible nitric oxide synthase; MPO- myeloperoxidase. Statistical significance was determined using Kruskal-Wallis followed by Dunn’s multiple comparisons test. Results are presented as mean ± SEM.

