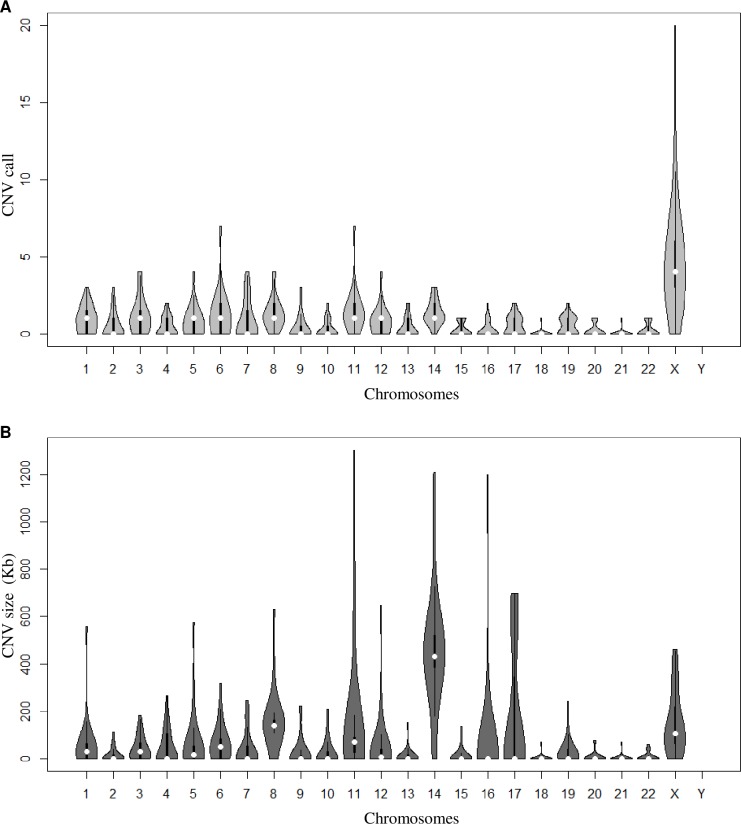
Fig 2. Chromosome distribution of copy number variation (CNV) in systemic lupus erythematosus (SLE) patients.
Violin plot (R package: vioplot v. 0.2) illustrating the distribution of the data and its probability density for call (A) and size (B) of the total number of CNVs per chromosome. The thicker black bars in the center represent the interquartile range, while the thin black line extended from it represents the 95% confidence intervals around the median (white dot).

