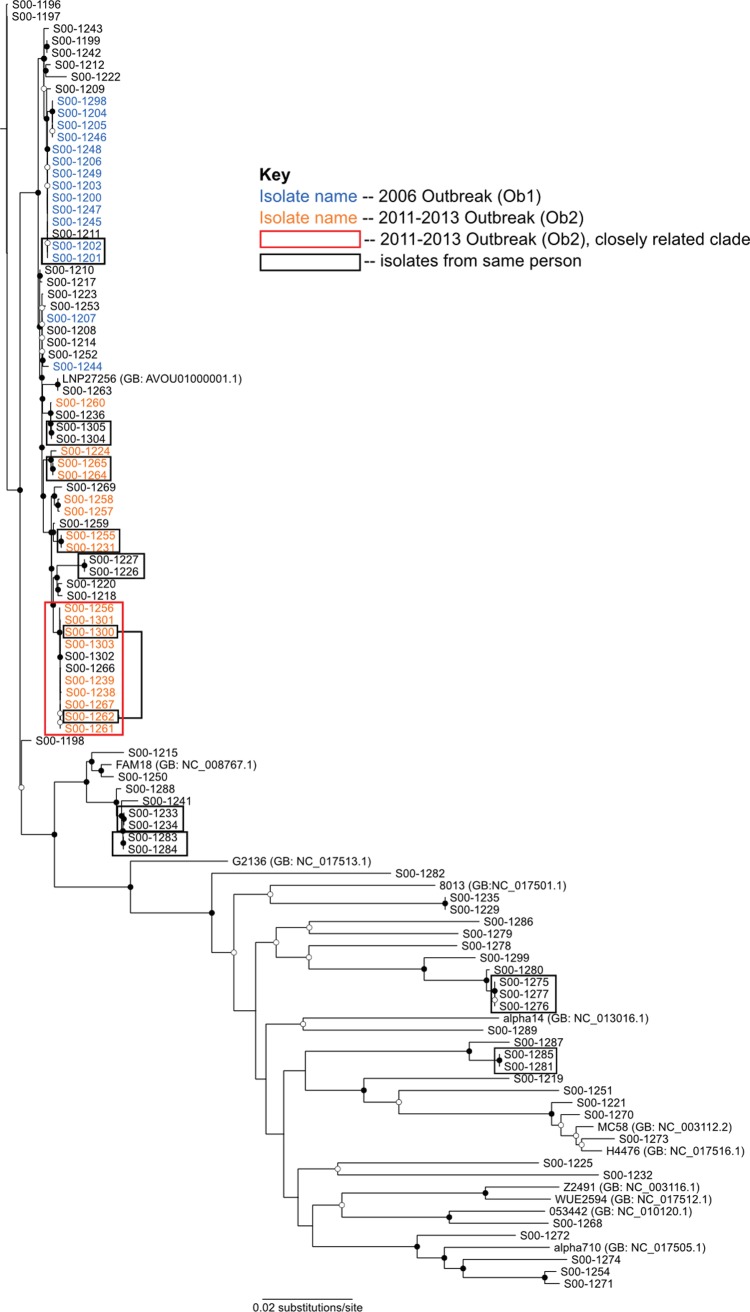
Fig 1. Phylogenetic relationship of Nm isolates from around NYC 2003–2013.
The tree is based on core genome SNPs and rooted on the oldest isolate. Open circles represent nodes with bootstrap support ≥50, while closed circles represent nodes with bootstrap support ≥95 based on 100 replicates. Those isolates that are part of the 2006 (Ob1) based on epidemiology outbreak have blue text. Those isolates that are part of the 2012 outbreak (Ob2) based on epidemiology have orange text, with the closely related subclade indicated by a red box. Isolates from the same individuals are indicated by black boxes.

