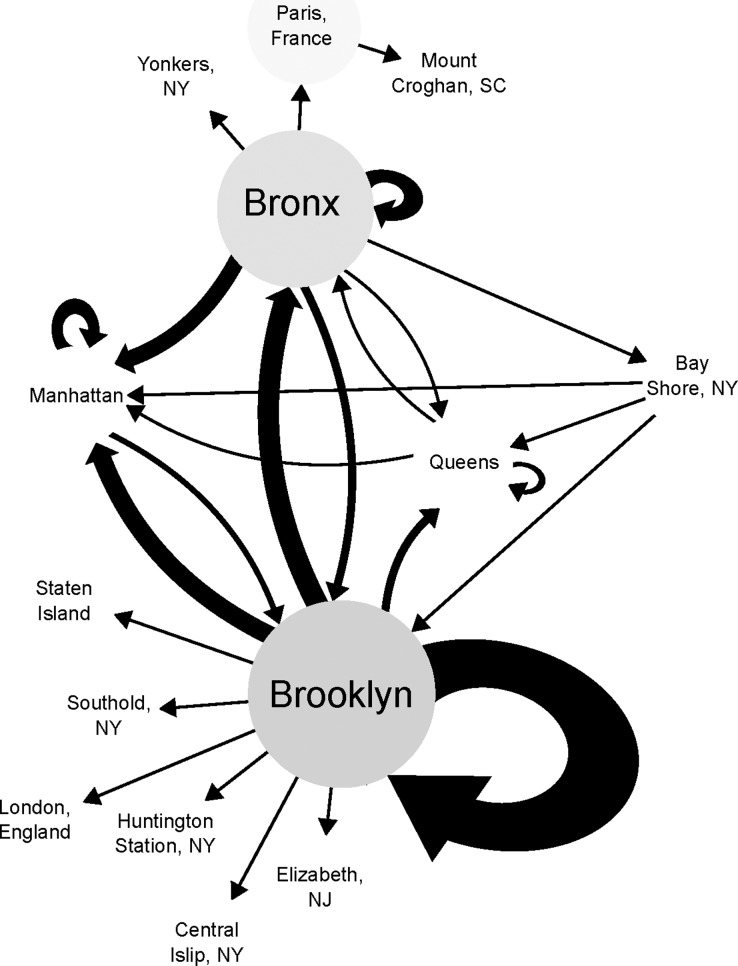
Fig 2. Betweenness and the movement of Nm around NYC boroughs.
Locations with higher betweenness values have a darker colored circle. The arrows indicate the direction of movement with the size of the arrowheads and thickness of arrow scaling with the amount of movement between those locations, with a larger size indicating greater movement.

