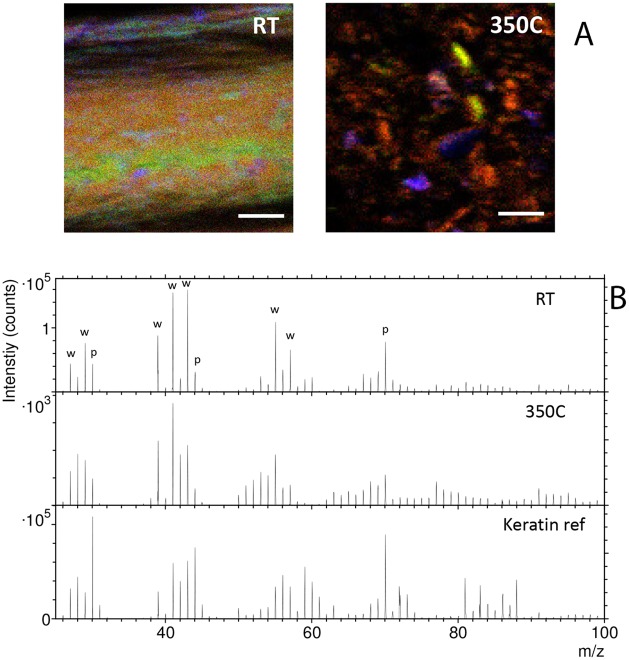
Fig 5. Positive ion ToF-SIMS data of the control (RT) and condition 2 (350 °C) feathers, keratin reference sample and tape support.
A) Ion images show the signal intensity distributions of C4H8N+ (green), representing protein, C5H9+ (red), representing hydrocarbons, and Ca+ +CaOH+ (blue). Scale bar 100 μm. B) Mass spectra generated from the protein-rich areas of the control and 350°C feathers, a keratin reference, and the tape substrate onto which the feather samples were attached (see text). Strong peaks at m/z 70, 30 and 44 in the keratin spectrum and the relatively strong signal of these peaks also in the feather spectra are consistent with proteinaceous material in both feather samples.”w” indicates hydrocarbon ions, and”p” indicates nitrogen-containing ions that show strong intensity for proteins. Optical micrographs of the feather samples are provided in S6 Fig.

