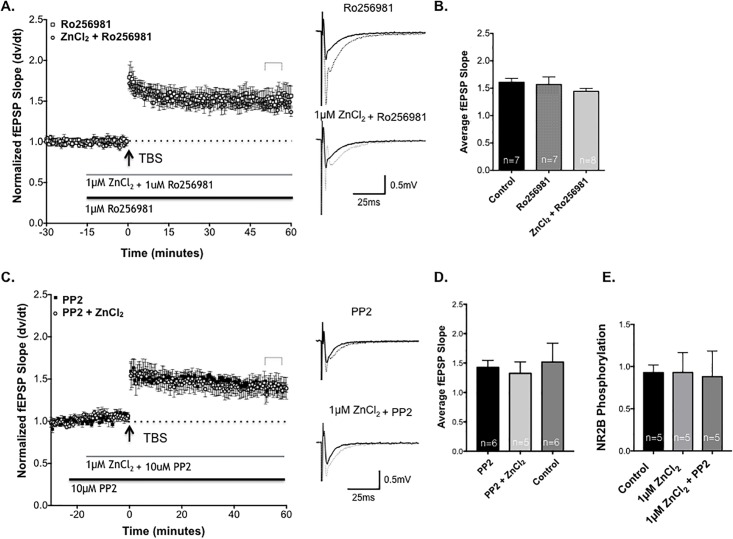
Fig 6. NR2B blockade and Src kinase inhibition block Zn2+ enhancement of Schaffer collateral-CA1 LTP.
(A)Time course of LTP of SCH-evoked fEPSPs in 1μM ZnCl2 + Ro 25–6981 slices (circles, n = 8), compared to LTP in slices treated with 1μM Ro 25–6981 (black bar, squares, n = 7). There was no significant difference in the magnitude of LTP between groups. Sample traces for each treatment shown to right, before (dark traces) and 50 minutes after (light traces) TBS. (B) Summary of SCH-CA1 LTP 50 minutes post-TBS in slices treated with Ro25-6981 and Ro25-6981 + ZnCl2, compared to drug-free control slices (n = 7; P>0.05; 1-way ANOVA). (C) Time course of LTP elicited by TBS (arrow) in the presence of 10μM PP2-treated slices (squares, n = 6), compared to LTP in PP2 + 1μM ZnCl2 treated slices (circles, n = 5). The magnitude of LTP in the two groups were not significantly different (P>0.05; Student’s t-test). Sample traces for each treatment shown to right, before (dark traces) and 50 minutes after (light traces) drug application. (D) Summary of normalized fEPSP slope 50 minutes after TBS in slices treated with 1μM ZnCl2 + PP2 versus PP2. Statistical data are presented as mean ± SEM. (E) Western blot analysis showing the Mean ± SEM of phosphorylation at Y1472 on NMDA NR2B receptor subunits in the untreated control slices, compared to slices treated with 1μM ZnCl2 or with 1μM ZnCl2 and the PP2 inhibitor. Zn2+ treatment did not significantly alter the state of phosphorylation of the NR2B subunits at Y1472 (P>0.05; Dunnett’s multiple comparison test).

