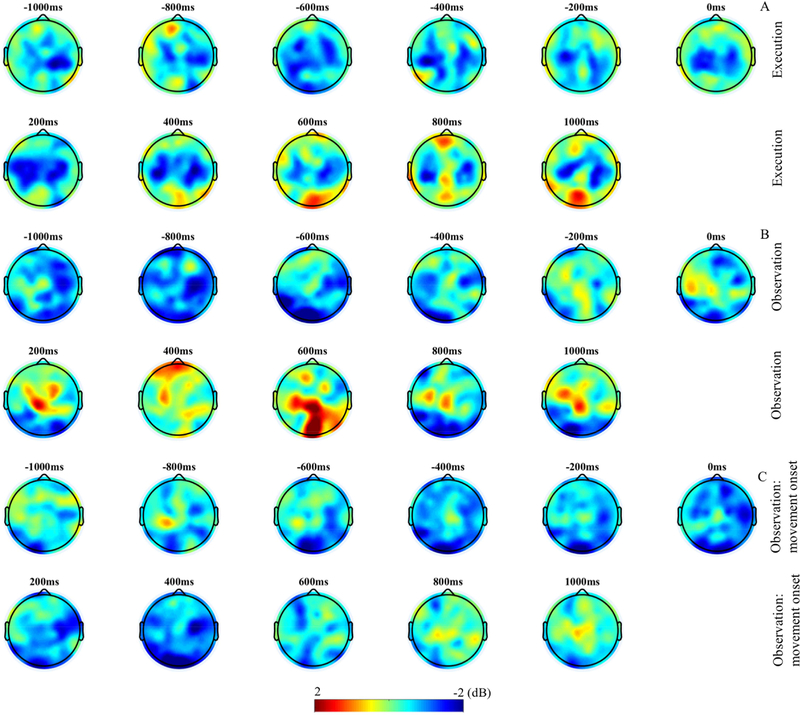
Figure 5.
(A-C) Topographic maps of mu/alpha (6–9Hz) band ERSP in 200ms interval. The top two panels (A) display activity for the execution of movement condition. The middle two panels (B) show activity for the observation of movement condition and the bottom two panels (C) display activity for the observation condition time locked to movement onset.

