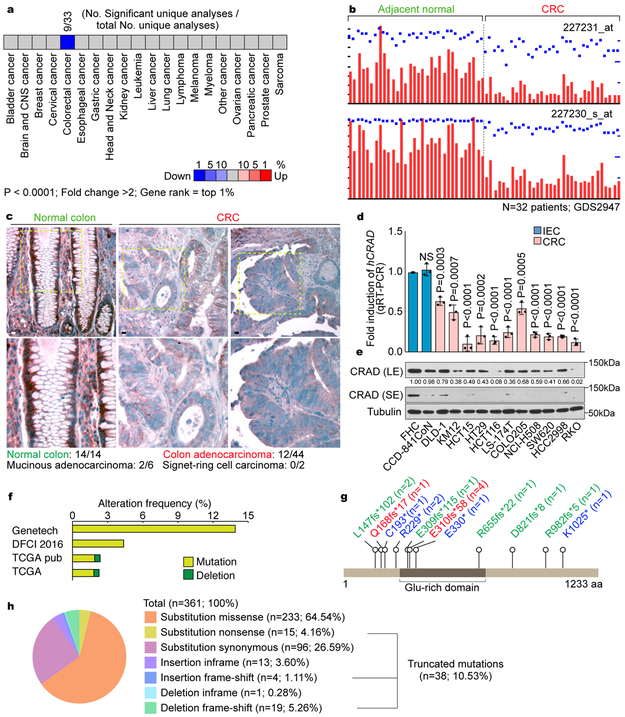
Figure 1. CRAD inactivation in CRC.
a, Oncomine analysis of CRAD expression in human cancers.
b, GEO (GDS2947) analysis of CRAD expression in adjacent normal tissues vs. colorectal adenoma tissues. n=32 patients; probes: 227231_at and 227230_s_at.
c, IHC of CRAD in normal colon and colorectal adenocarcinoma. Images are representative of 14 normal colon and 38 CRC samples.
d and e, CRAD expression in IECs and CRC cells. qRT-PCR (d; n=3 independent experiments) and IB (e) analyses. The representative images are shown from three independent IB experiments.
f, Genetic alteration of CRAD. cBioportal datasets: Genentech 2012 (n=72 patient samples); TCGA pub 2012 (n=212 patient samples); TCGA provisional (n=220 patient samples); DFCI 2016 (n=619 patient samples).
g and h, COSMIC analysis of CRAD mutations in CRC. n values indicate patient sample number.
Scale bars indicate 50μm; Error bars: mean ± S.D.; NS: not significant (P>0.05); Two-sided unpaired t-test.

