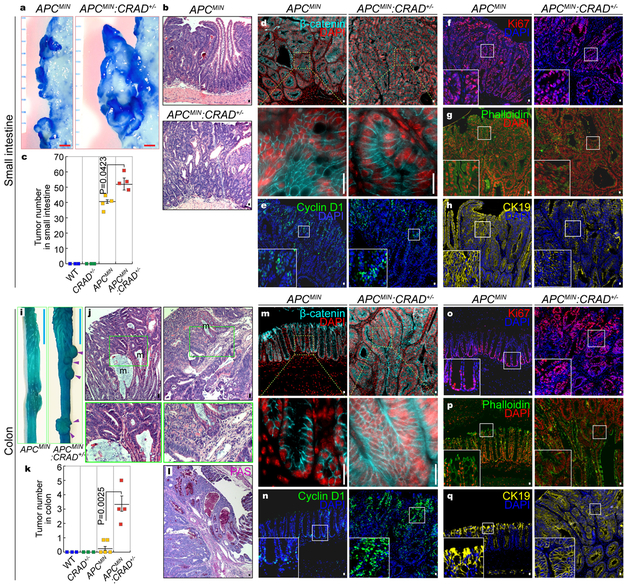
Figure 6. Accelerated intestinal tumorigenesis by CRAD heterogeneous KO.
a, Representative images of intestinal tumors from the small intestine of APCMIN (n=4 mice) and APCMIN:CRAD+/− (n=4 mice) (4mo of age).
b and c, The increase of small intestinal tumors in APCMIN:CRAD+/− (n=4) mice, compared to APCMIN (n=4) mice. Representative H&E images of small intestinal tumors in APCMIN and APCMIN:CRAD+/− mice (b). Quantification of adenomas (4mo of age; c).
d-h, IHC of intestinal tumors from the small intestine of APCMIN and APCMIN:CRAD+/− mice. β-catenin (d); Cyclin D1 (e); Ki67 (f); Phalloidin (g); CK19 (h).
i, Colorectal tumors in APCMIN:CRAD+/− (n=4) mice (4mo of age; Arrowheads).
j, H&E staining of the colorectal tumors in APCMIN:CRAD+/− mice. m: mucin-accumulated lesion. 4mo of age. n=3.
k, Comparative analysis of colorectal tumors (4mo of age). WT (n=3 mice); CRAD+/− (n=3 mice); APCMIN (n=5 mice); APCMIN:CRAD+/− (n=4 mice.)
l, PAS staining of colorectal tumors in APCMIN:CRAD+/− mice.
m-q, IHC of colorectal tumors from APCMIN and APCMIN:CRAD+/− mice (4mo of age). β-catenin (m); Cyclin D1 (n); Ki67 (o); Phalloidin (p); CK19 (q).
Images of panel b, d-h, j, and l-q are representative of IHC experiments from three independent tumors; Red scale bars indicate 1mm; Blue scale bars indicate 10mm; Black or white scale bars indicate 20μm; Error bars: mean ± S.D.; Two-sided unpaired t-test.

