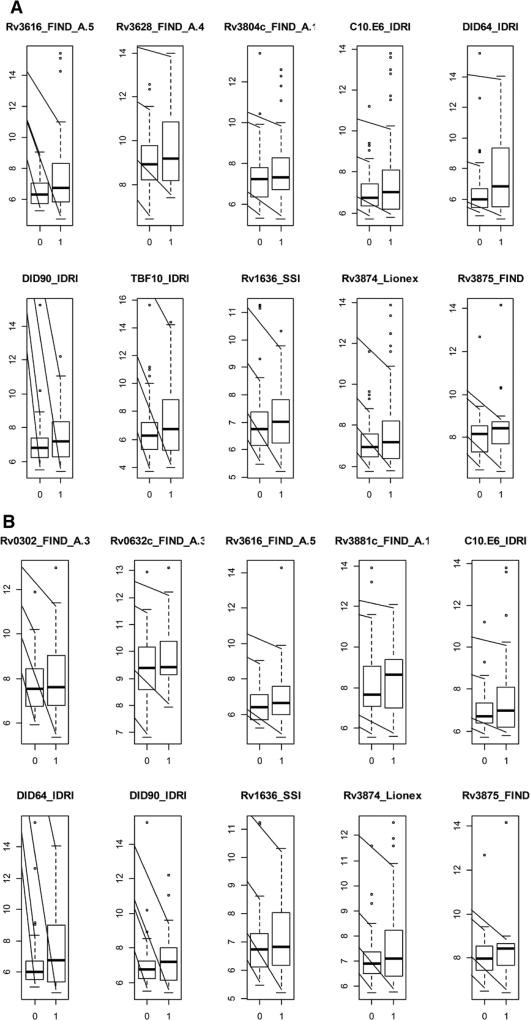
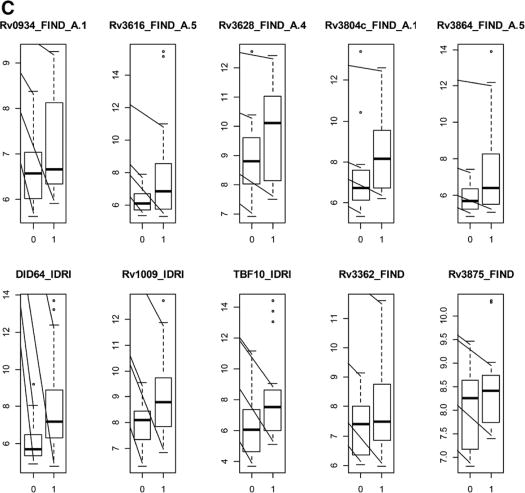
FIGURE 2.
Boxplots of the log2-transformed antibody responses for the 10 single antigens having the highest AUC for discrimination between children classified as unlikely TB (designated as 0 on the x axis) versus children classified as confirmed TB (designated as 1 on the x axis) for (A) all ages; (B) children 12–59 months old and (C) children 60 months old and older. The y axis represents log2-transformed antibody responses.


