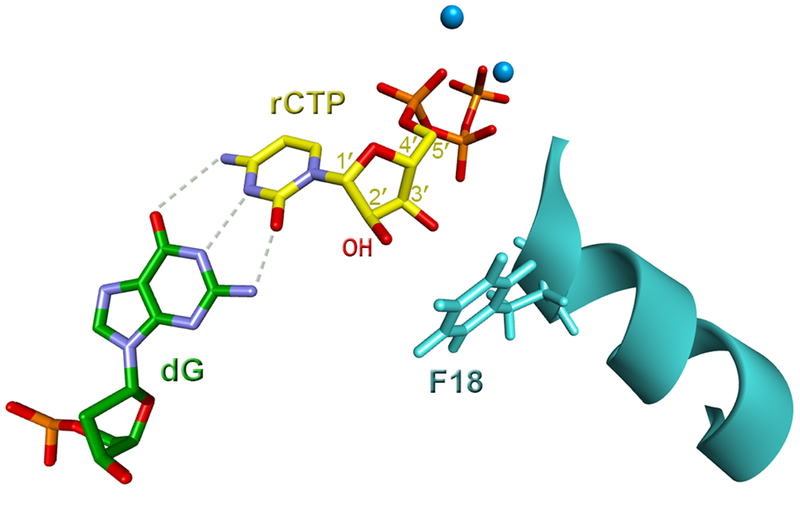
Figure 3. Insertion of an incoming rCTP (shown in yellow) opposite template dG (shown in green) by human pol η (light blue).
The F18 steric gate residue of hpol η, the 2’ OH group of the sugar ring in rCTP, and Ca2+ ions (blue) are indicated. (PDB ID 5EWE) (Su et al., 2016). For details see section 3.2. A color version of the figure is available online.

