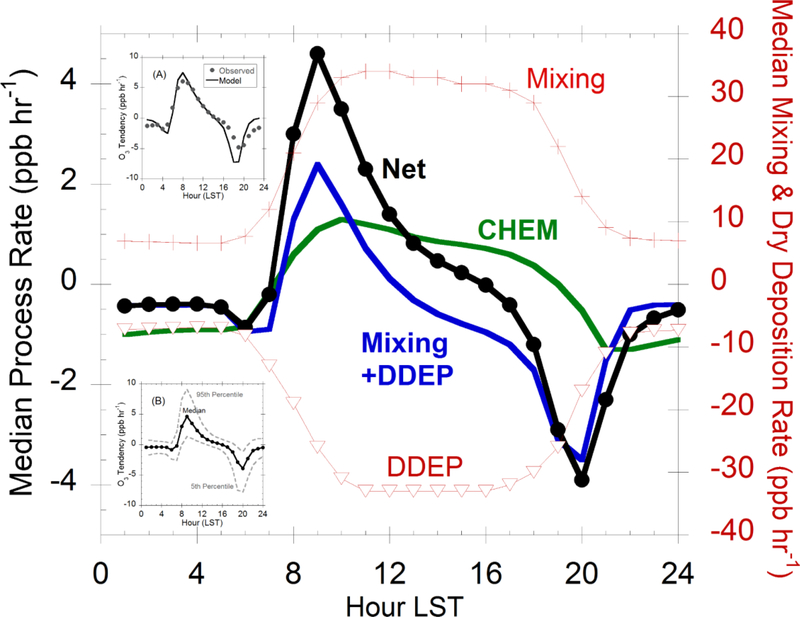
Figure 1:
Diurnal variation of CMAQ estimated O3 process tendencies regulating variations in ground-level O3. Values shown are median values (of July 2010 monthly average diurnal variations) across all Continental U.S. land cells. CHEM represents the net rate of change due to atmospheric chemical production and loss, DDEP is the rate of change due to dry deposition to the earth’s surface, Mixing represents the rate of change due to turbulent mixing, and Net is the sum of tendencies from all modeled processes regulating O3. Note that the values for the Mixing and DDEP terms are shown on the y-axis on the right. Inset A: Comparison of model and observed average (for July 2010 and across all AQS sites in the Continental U.S) diurnal surface O3 tendency. Inset B: Distribution of model O3 tendency across all land cell across the Continental U.S. The lower percentile curve represents locations influenced by fresh NOx emissions as is evident by the large negative tendency associated with the evening traffic rush hours. Traffic related NOx emissions in the morning rush hours result in titration of O3 entrained from aloft and the consequent smaller magnitude of O3 tendency at these locations.

