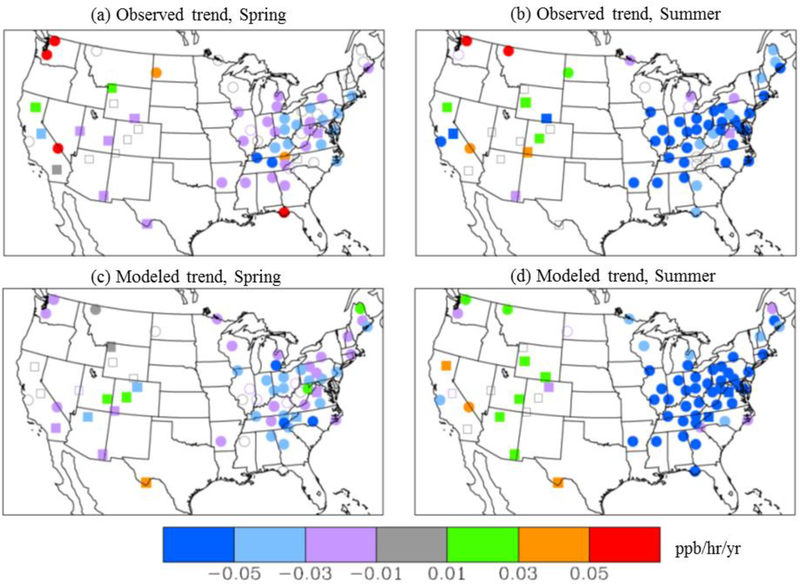
Figure 2:
Inferred changes in seasonal entrainment rates of aloft O3 to the surface over the past two decades. Trends in observed average 8–9 am ground-level O3 tendency in units of ppb hr−1 yr−1 during 1990–2010 at CASTNET monitoring locations are shown for (a) Spring (March-May) and (b) Summer (June-August). (c and d) same as (a and b) but based on model simulations. The hourly tendency at each monitor is estimated as the difference in measured O3 at an hour and at the previous hour. Seasonal-averages of the estimated tendencies at 8:00am and 9:00 am (times when the net O3 tendency peak) are computed for each year and the trends for the 21-year period are shown. Squares indicate high-elevation sites (altitude > 1000m ASL), while circles represent sites with altitude < 1000m ASL. Filled symbols represent locations where the estimated trends are significant at the 95% level, while open symbols are locations where they are not. These trends are only computed at CASTNET monitors that reported data for at least 11 of the 21-years. It should be noted that both the magnitude and directionality of the trend at individual locations can change if a different subset of years within the 21-year period or a different data completeness-criteria is chosen.

