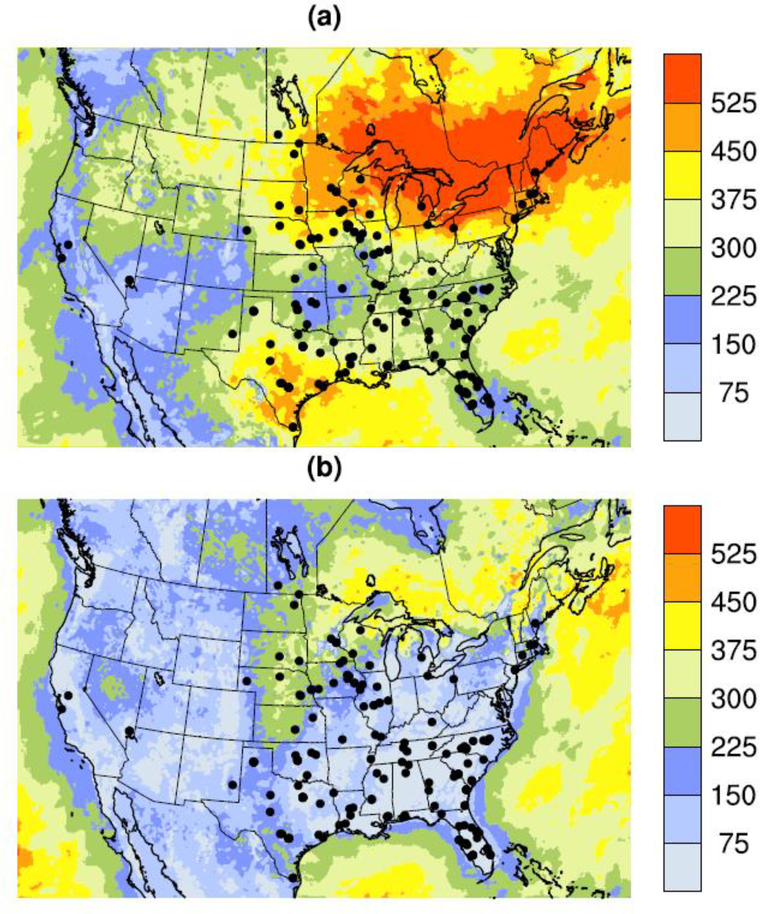
Figure 3:
May-September 2010 average e-folding distances for nocturnal O3 (at 0700 UTC) for altitudes (a) between 400–500m AGL and (b) 10m AGL inferred from CMAQ O3 simulations. The dots indicate locations of tall towers (>400 m) based on the list of tallest structures between 400–500m height available at: https://en.wikipedia.org/wiki/List_of_tallest_structures_%E2%80%93_400_to_500_metres. To estimate the e-folding distance, for a given model altitude, we first calculate the correlation between the synoptic component of the 0700 UTC O3 time series at a grid point with that at each of the other grid points. For each location we then examine the relationship between this correlation and the distance between the points (Note that the relationship between correlation and distance generally follows an exponential decline). The e-folding distance at a location is the distance at which correlations in O3 at this location with that at any remote location drops below 0.37. The e-folding distance is thus an indicator of spatial correlation in the O3 field.

