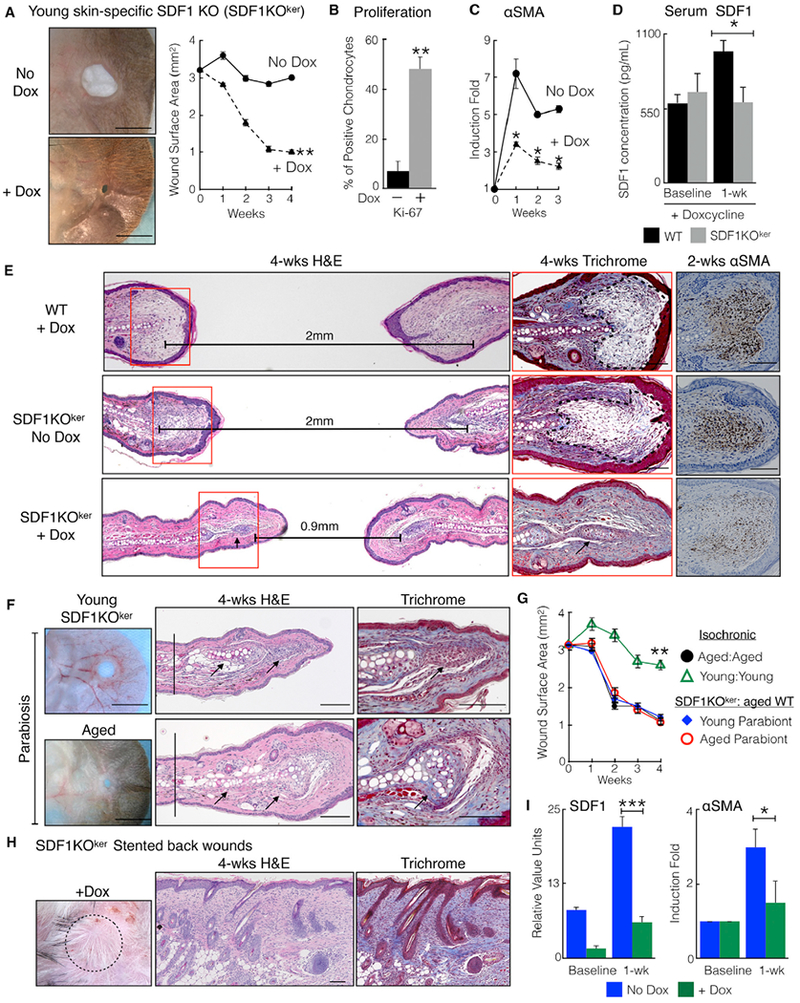
Figure 3. Skin-Specific SDF1 Knockout Mice Demonstrate Improved Tissue Regeneration.

(A) Young skin-specific SDF1 knockout mice (SDF1KOker mice) treated with doxycycline demonstrate improved ear hole closure. Shown are representative photographs and ear hole measurements. n = 6. **p = 0.007.
(B) Ear wound edge tissue from doxycycline-treated SDF1 KOker mice exhibit increased chondrocyte proliferation and decreased fibrosis. Shown is quantification of Ki-67 immunostaining in chondrocytes 4 weeks post-injury. n = 6. **p < 0.01.
(C) Relative αSMA transcript levels. n = 24. *p < 0.03.
(D) Doxycycline-treated SDF1KOker mice do not induce SDF1 blood serum levels 1 week after injury. n = 6 for WT mice and n = 5 for SDF1 KOker mice. *p = 0.02.
(E) Doxycycline-treated SDF1KOker mice regenerate injured ear tissue. Shown are H&E, trichrome, and αSMA staining (brown cells). Controls were doxycycline-treated wild-type (WT) mice and SDF1KOker mice without doxycycline. The trichome images are taken from the red squares. Dotted areas mark scars; the black arrow marks chondrocyte proliferation. Horizontal lines indicate the distance between cartilage end plates. n = 6.
(F) Parabiosis between doxycycline-treated SDF1KOker mice and aged WT mice exhibiting improved ear hole closure. Shown are photographs of H&E staining, and trichrome staining. Black arrows indicate chondrocyte proliferation, and vertical lines indicate cartilage end plates. n = 3.
(G) Ear hole measurements. n = 3. **p < 0.01, comparing young: young with either parabiont of young SDF1KOker :aged WT pair.
(H) Stented back wounds on doxycycline-treated SDF1KOker mice demonstrate diminished scar formation. Shown are photographs of H&E staining, and tri chrome staining 4 weeks post-injury. n = 5.
(I) Relative SDF1 and αSMA transcript levels in back skin wound edge tissue. n = 5. *p = 0.02, ***p = 0.0003.
N, biological replicates per group. Error bars are SEM. Scale bars, 100 μM (histology) and 2 mm (photographs). Nuclei are counterstained blue. See also Figure S3.
