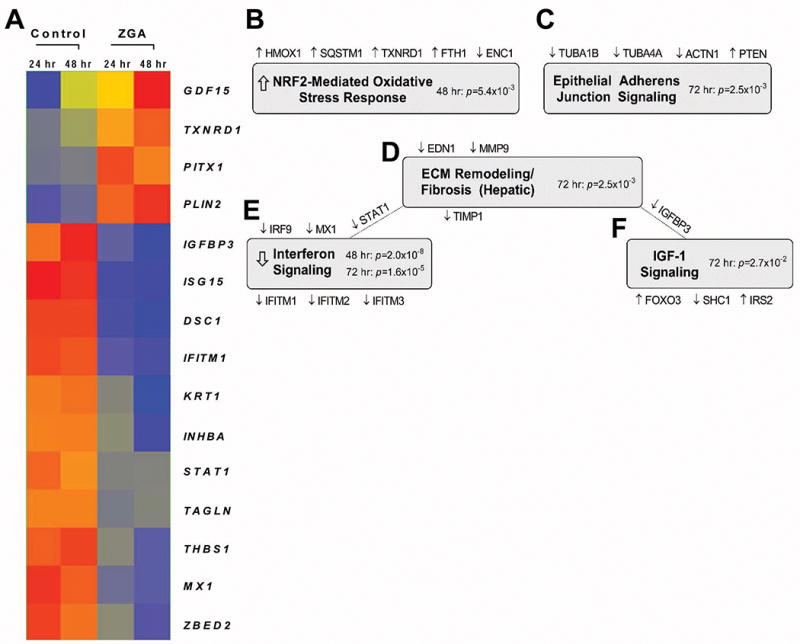
Figure 1. Microarray profiling of ZGA-treated keratinocytes.

A. Expression heatmap of 15 significantly regulated genes displaying fold change >5 at 48 h and 72 h post-ZGA treatment. Red = higher expression, blue= lower expression. Expression-based gene clustering was performed using Genespring 13.0. B – F Top 5 enriched pathways in keratinocytes in response to ZGA treatment as determined by Ingenuity Pathway Analysis (IPA). Implicated genes and their corresponding regulation are shown above and below the shaded pathway titles; in some instances, genes are common to 2 pathways. Enrichment p-values were calculated using Fisher’s exact test with Benjamini-Hochberg correction; arrows represent statistically significant Z scores reflecting pathway activation/inhibition.
