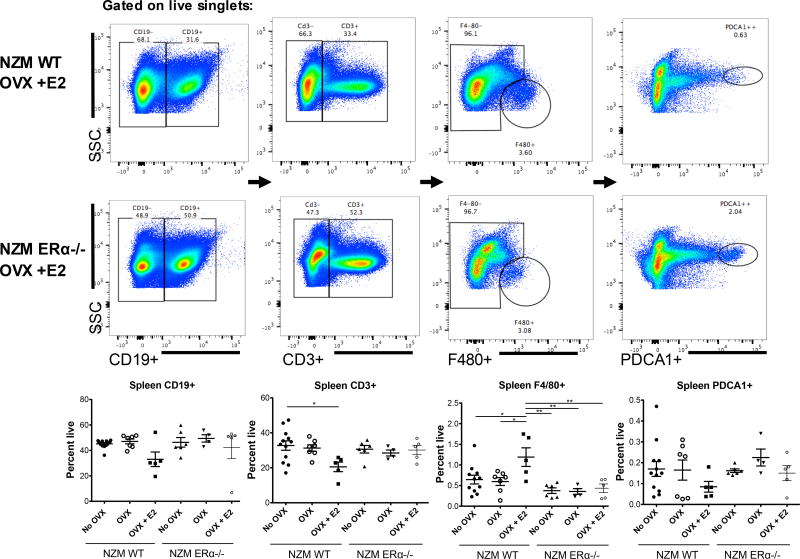
Figure 7. Flow cytometry of isolated spleen cells of NZM WT vs. NZM ERα−/− mice.
Single cell suspensions of spleen cells were stained with CD19, CD3, F4/80, and PDCA, with gates set by FMO. There were no significant differences in B cells among the groups although NZM WT OVX +E2 treated mice trended towards reduced numbers. These mice also had a significant reduction in total CD3+ T cells compared with intact NZM WT mice, and significantly increased percent of mature macrophage by F4/80 staining compared with all groups, suggesting ERα is required for this effect. Although there were slight differences in numbers of PDCA1+ cells (pDCs), there were no significant differences.

