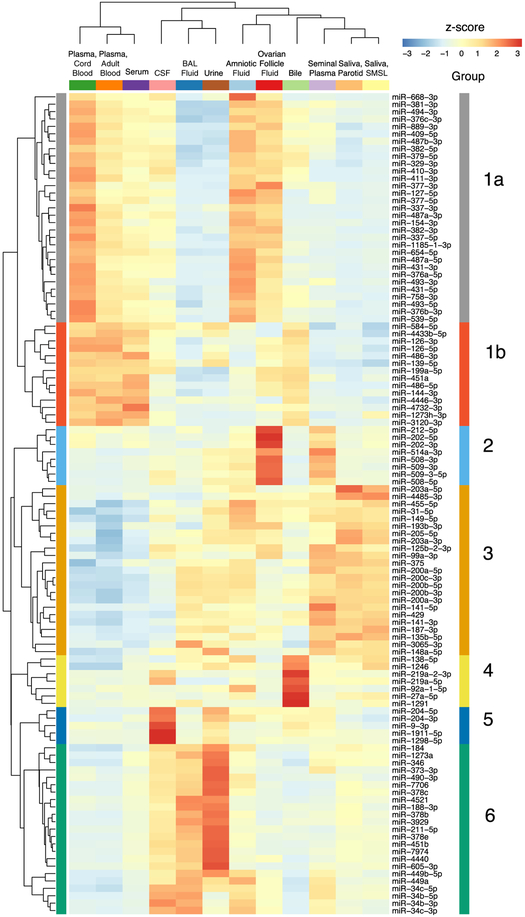
Figure 3. miRNAs with Highly Correlated Read Counts across 12 Biofluids.
Hierarchical clustering heatmap depicting scaled miRNA read counts for six groups (1–6) of five or more miRNAs with similar abundance patterns across biofluids using Bayesian relevance network analysis. Z scores indicate levels of miRNA relative to levels of the same miRNA in other biofluids.

