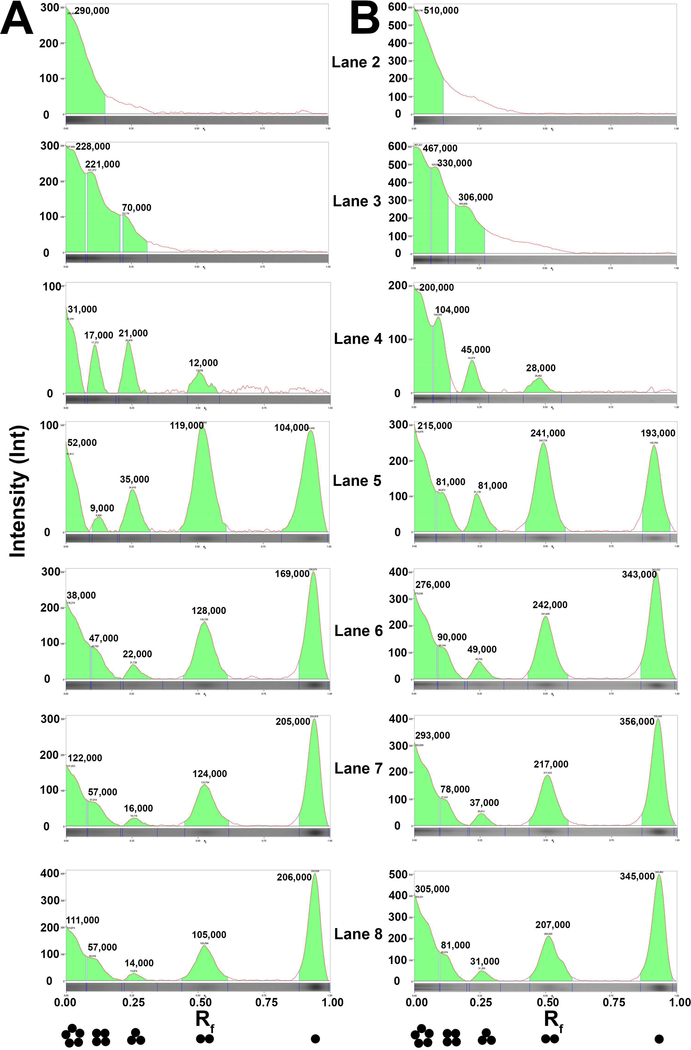
Fig. 5. Densitometric quantification of the pCN-PAGE gels.
Lane profile densitometry including Rf (retention factor; x-axis) determination was performed upon analyzing individual lanes (lane 2–8) of each gel shown in Fig. 4D (Panel A) and 4B (Panel B) using Image Lab Software version 5.1 build 8 (Biorad). Background subtraction was done as per the available tools. The Lane and Bands analysis tool was used to measure the intensities (y-axis) and volumes (the green shaded areas) of the protein bands corresponding to the indicated oligomeric states (black closed circles). Note that analysis excludes the top region of the gels which displays an anomalous gel mobility behavior of the electrophoresed protein sample.

